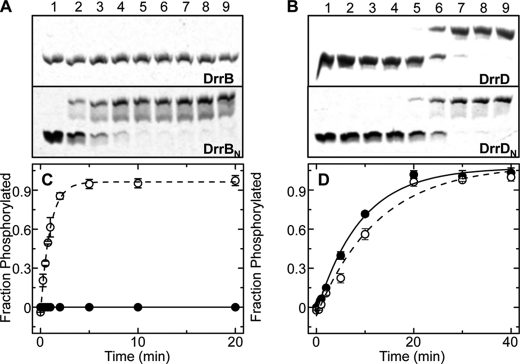
FIGURE 3.
Autophosphorylation of DrrB, DrrD, and their isolated receiver domains. A, phosphoprotein affinity gel electrophoresis using Phos-tagTM acrylamide gel electrophoresis separation of DrrB∼P from DrrB and DrrBN∼P from DrrBN (upper and lower gels, respectively). B, similar gels depicting the separation of DrrD∼P from DrrD and DrrDN∼P from DrrDN (upper and lower gels, respectively). In both A and B, lanes 1–9 correspond to samples collected 0, 20, 40, 60, 90, 120, 300, 600, and 1200 s following the addition of PA. Each autophosphorylation reaction was performed with 10 μm RR and 20 mm PA in 50 mm Tris, 100 mm NaCl, 10 mm MgCl2, and 2 mm BME at pH 7.5. At the indicated time points, 15-μl aliquots were removed from the reaction solution and mixed with 5 μl of 4× SDS loading buffer (0.8% (w/v) SDS, 250 mm Tris (pH 6.8), 4% (v/v) glycerol, 0.08% (v/v) bromphenol blue, and 572 mm BME) to stop the reactions. C and D, plots of the corrected fraction of phosphorylated DrrB (●) and DrrBN (○) (C) and DrrD (●) and DrrDN (○) (D) versus incubation time with PA. In each plot, the fraction of phosphorylated protein from each time point was characterized using the average of at least three independent phosphoprotein affinity gel electrophoresis experiments, with error bars representing S.D. Solid and dashed lines depict the first-order exponential decay fit of the indicated points for the full-length and isolated receiver domains, respectively.

