
FIGURE 4.
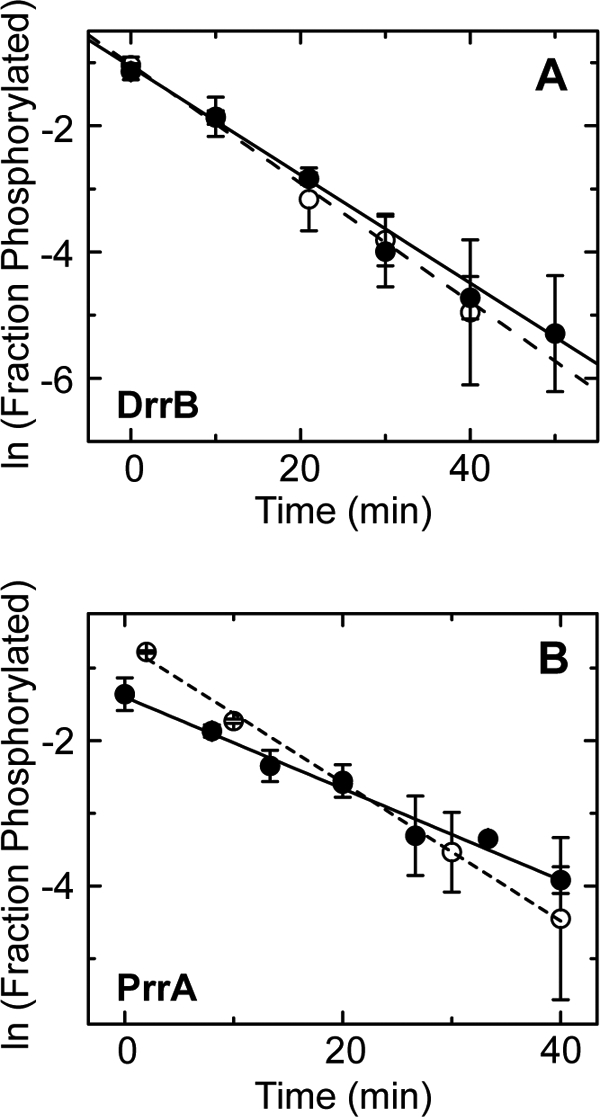
Rate of autodephosphorylation of DrrB, PrrA, and their isolated receiver domains. A and B, plots of the natural logarithm of the observed fraction of phosphorylated DrrB (●) and DrrBN (○) (A) and PrrA (●) and PrrAN (○) (B) at various times after removal of the phosphodonor (PA). Solid and dashed lines represent the best fit linear regression of the plots of the full-length RRs and isolated receiver domains, respectively. Each data point represents the average of two independent measurements, with error bars indicating S.D.