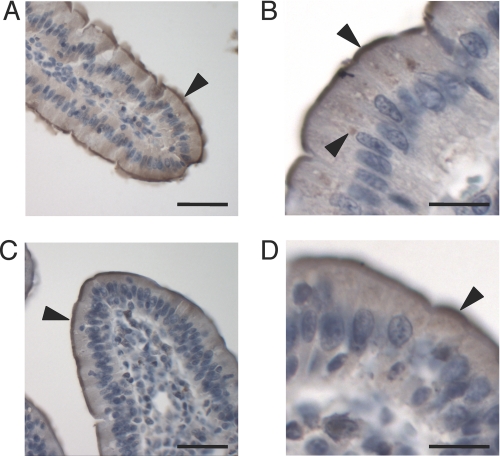
FIGURE 3.
Localization of Ctr1 in rat duodenum and pig jejunum. Tissues were probed with anti-Ctr1 antibody (1:200) and analyzed by immunohistochemistry. A and B, rat duodenum. C and D, pig jejunum. The arrowheads indicate some regions of immunopositive staining. A and C, scale bars = 50 μm; B and D, scale bars = 20 μm.

