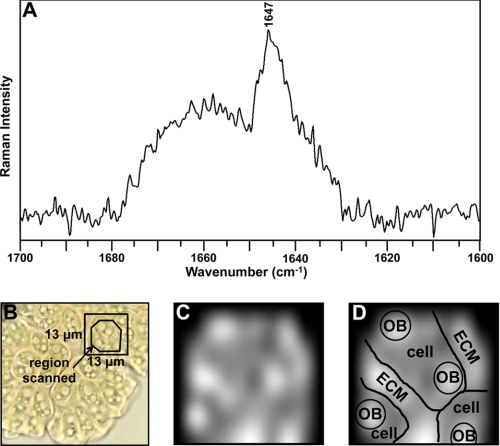
FIGURE 7.
Mapping of methylated botryococcenes in a B. braunii colony. A, in vivo Raman spectrum of a B. braunii colony. The laser of the confocal Raman microscope was focused on a 13 × 13-μm region of a colony of B. braunii, as shown in B, and the Raman spectrum of the region recorded. B, light microscope image of the B. braunii colony before photobleaching for Raman spectroscopy. Boxed region indicates region used for analysis in A. C, mapping of the 1647 cm−1-specific botryococcene Raman band in the B. braunii colony. D, graphical representation of colony structure in C. OB, oil body; ECM, extracellular matrix.

