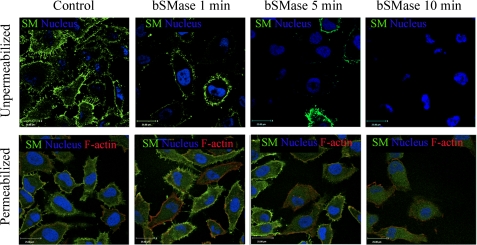
FIGURE 4.
Effects of bSMase on plasma membrane and intracellular SM. Presence of SM was monitored by lysenin-Venus (green channel) binding to SM after bSMase treatment (25 milliunits/ml). Cells were fixed, and the nonpermeabilized (upper panels) or permeabilized (lower panels) cells were analyzed by confocal microscope. Nuclei was visualized with Draq5 (blue), and in permeabilized cells, F-actin was visualized with rhodamine phalloidin staining (red).

