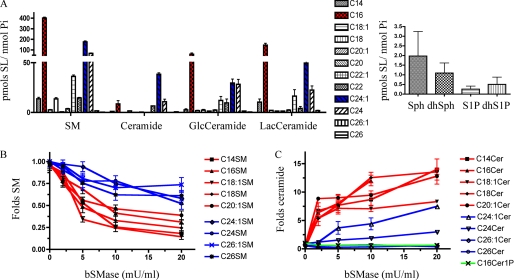
FIGURE 5.
Changes in SLs after bSMase treatment in HeLa cells. A, the SL profile of HeLa cells was measured in serum-free conditions. C16 (red), C24:1 (blue), and C24 were the main acyl chains among the different acyl chain species analyzed. Sph and S1P and their dihydro (dh) forms were also measured. B, levels of SM and ceramide species. After bSMase treatment (25 milliunits (mU)/ml, 10 min), the SL profile was monitored, and only SL species that underwent significant changes are presented (red, LC species; blue, VLC species): Sphingomyelin (B) and ceramide (C) species. GlcCeramide, glucosyl ceramide; LacCeramide, lactosyl ceramide; Cer, ceramide.

