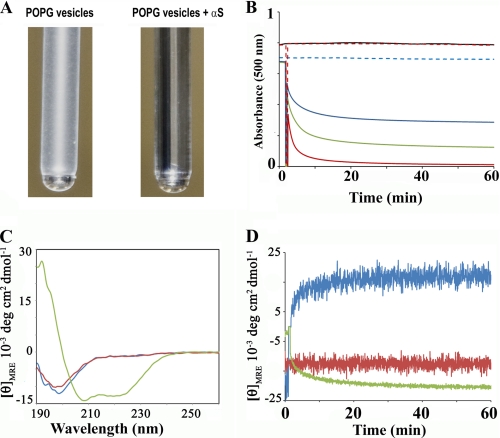
FIGURE 1.
Phospholipid vesicle clearance by α-synuclein. A, photograph of test tubes containing 600 μm POPG vesicles before and 60 min after addition of 60 μm α-synuclein. Because of their large size, the vesicles scatter light, but the addition of α-synuclein causes the suspension to become clear. B, clearance of phospholipid vesicles in the presence of varying amounts of α-synuclein was continually monitored by recording the apparent absorbance at 500 nm. Control traces for POPG vesicles (400 μm) in the absence of α-synuclein are indicated by the broken blue trace. POPG vesicles (400 μm) incubated with 10 μm, 20 μm and 40 μm of α-synuclein are shown with the blue, green, and red traces, respectively. Control POPC vesicles (400 μm) in the absence and presence of 40 μm α-synuclein are given by the black and broken red lines, respectively. Large non-extruded vesicles were used. C, circular dichroism was used to distinguish whether the observed vesicle clearing effect was mediated by α-helical or misfolded, β-sheet containing α-synuclein. α-synuclein (20 μm) was incubated for 5 min with large non-extruded vesicles. The spectrum remained essentially unchanged in the presence of POPC-containing vesicles (1:20 protein to lipid molar ratio, red line) in agreement with previous findings that α-synuclein does not significantly interact with such lipids (27). α-Synuclein alone (blue); α-synuclein with POPC vesicles (red); α-synuclein with POPG vesicles (green). D, change in the mean residue ellipticity value is plotted as a function of time. A protein to lipid molar ratio of 1:20 was used for the experiment. 197.5 nm (blue); 203 nm (red); 222 nm (green). As expected for a simple two-state transition from random coil to α-helical structure, the ellipticity at the isosbestic point (203 nm) did not show any temporal changes. In contrast, the traces obtained at 197.5 nm and 222 nm exhibited spectral changes indicative of rapid α-helix formation within the first 5 min.

