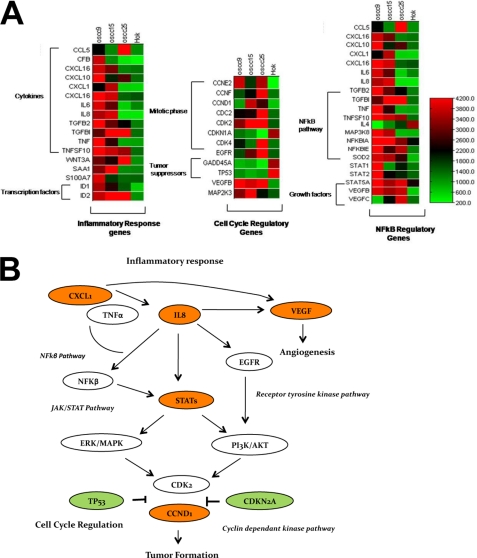
FIGURE 2.
Global gene expression profiles in OSCC identify the dysregulation of important gene families. A, cluster analysis of genes in OSCC lines is shown. The heat maps show the differentially regulated genes and their clustering into functional groups such as cytokines, growth factors, cell cycle regulation, and transcription factors. Signal intensities for genes were averaged across all replicates of the three OSCC cell lines and HOK cells. A color scale in which red represents up-regulation and green represents down-regulation depicts the expression level of the genes. B, shown is an alteration in signal transduction pathways and gene networking in OSCC development. A schematic diagram illustrates signal transduction cascades after stimulation of IL-8 or inflammatory response genes. The IL-8 activation could promote activation of JAK/STAT pathway and the receptor tyrosine pathway, which in turn would regulate the cyclin-dependent kinase pathway. The genes in red represent oncogenes, whereas genes in green are tumor suppressors.

