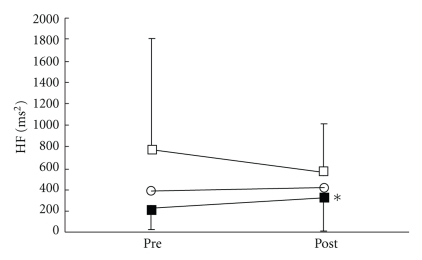
Figure 9.
Changes in the high-frequency (HF) component of heart rate variability. ○: control group. ■: local acupuncture point (LP) group. □: distal acupuncture point (DP) group. Values are presented as mean. SD represented with error bars in the LP and the DP groups. * significantly different from pre-treatment in the LP group (P < .05).

