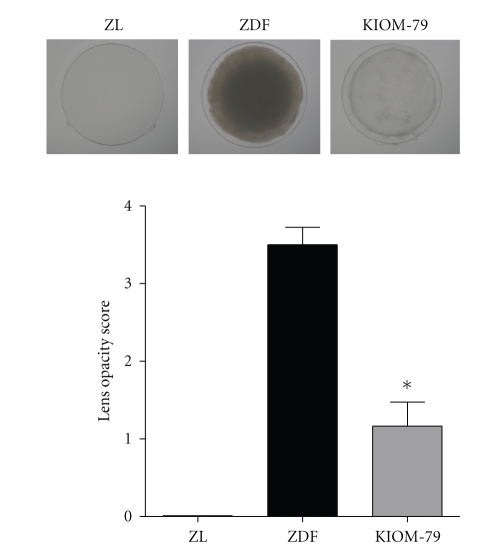
Figure 1.
Analysis of lens opacity. Representative images of lenses in each group. Lens opacity was analyzed (score 0 to 4) from each lens from a normal Zucker lean rat (ZL), Zucker diabetic fatty rat (ZDF), and ZDF rat treated with KIOM-79 (KIOM-79). All data are expressed as means ± SE, n = 8. *P < .01 versus vehicle-treated ZDF rats.

