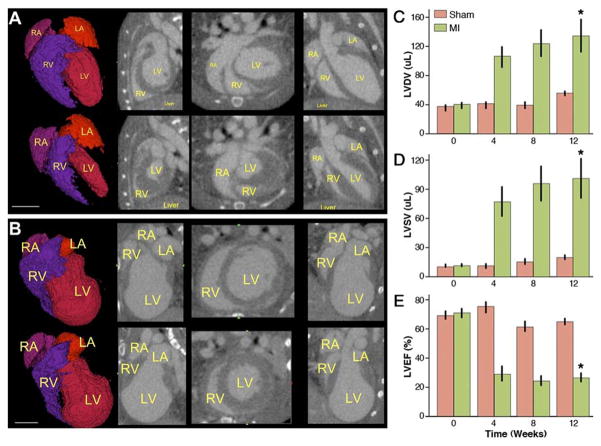
Figure 1. Gated Micro-CT Provides Insight Into MI–Induced Cardiac Remodeling.
(A) End-diastolic (top row) and end-systolic (bottom row) images of a normal mouse heart with chambers labeled in yellow. From left to right: rendered surface of blood volume, sagittal, axial, and coronal views. (B) Similar series of images from the same animal 12 weeks after left anterior descending artery (LAD) ligation (scale bar = 5 mm in both panels), showing clear signs of negative remodeling. (C) Graphic representation of increasing left ventricular (LV) diastolic volume (LVDV) over time after myocardial infarction (MI) as compared with relatively stable volumes in the sham-operated group. (D) Similarly, left ventricular systolic volume (LVSV) increased due to loss of cardiac muscle after infarction. (E) MI led to dilated cardiomyopathy with a significant loss of left ventricular ejection fraction (LVEF) as early as 1 month after LAD ligation (bars represent mean ± SE. *p < 0.05 compared with sham group by repeated-measures of analysis of variance). CT = computed tomography; LA = left atrium; MI = myocardial infarction; RA = right artrium; RV = right ventricle.

