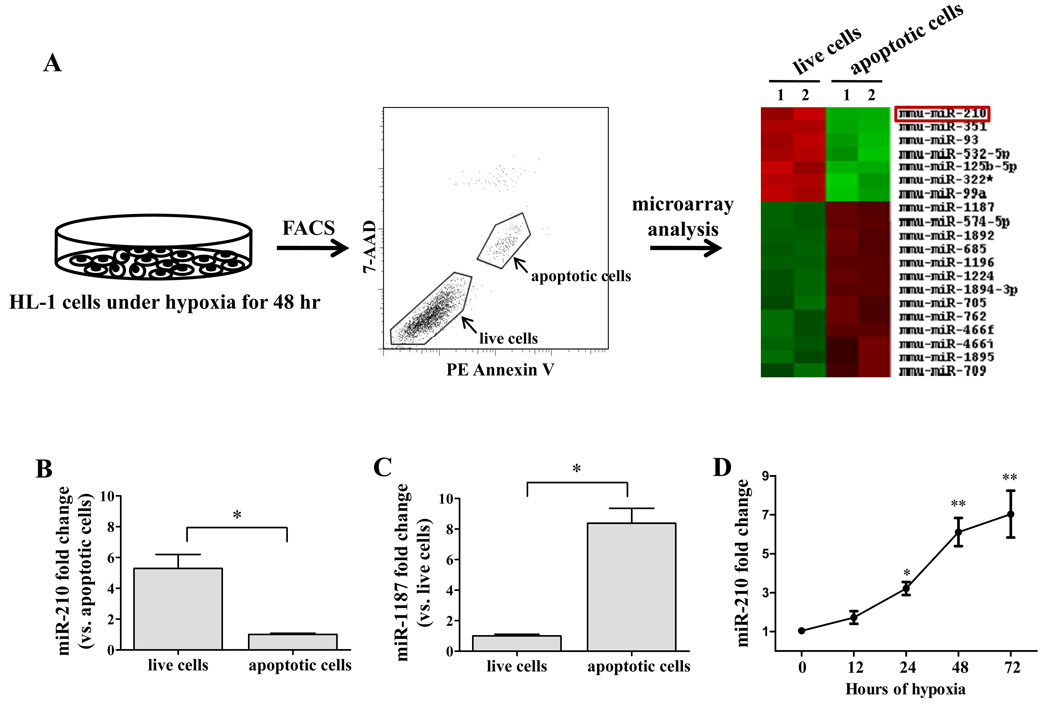
Figure 1.
(A) Schematic highlighting the microRNA microarray experimental design. HL-1 cells were subjected to hypoxia for 48 hours. Following FACS, apoptotic cells and live cells were collected for miRNA microarray analysis. T-test analysis demonstrates statistically significant differential miRNA expression across the two samples. miRNAs with P<0.05 were selected for cluster analysis. (B) Quantitative RT-PCR showed miR-210 expression was 5.3±0.9 fold higher in live cells than in apoptotic cells. Welch’s t-test was used. (C) Quantitative RT-PCR showed miR-1187 expression was 8.4±0.9 folds higher in apoptotic cells compared to in live cells. Welch’s t-test was used. (D) Time course regulation of miR-210 by hypoxia in HL-1 cells. Induction of miR-210 was discernible at 12 hours, becoming significant at 24 hours and increased progressively at 48 and 72 hour time points. 1-way ANOVA was used. *P<0.01 and **P<0.05.

