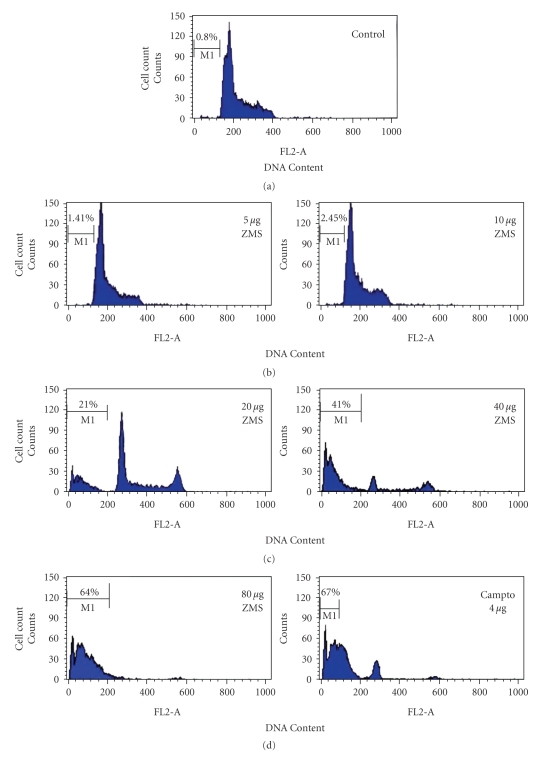
Figure 3.
Cell cycle analysis in HL-60 cells after ZMS treatment. HL-60 cells (1 × 10⁶ /mL) were treated with different concentration of ZMS for 24 hours. Cells were stained with PI to determine DNA fluorescence by flow cytometer. Sub-GO population indicative of DNA damage was analyzed from the hypodiploid sub-Go fraction (<2n DNA) of DNA cell cycle analysis. The cells for hypodiploid (sub GO/G1, <2n DNA) population were analyzed from FL2-A versus cell counts shown in % and representative of one of the three similar experiments.

