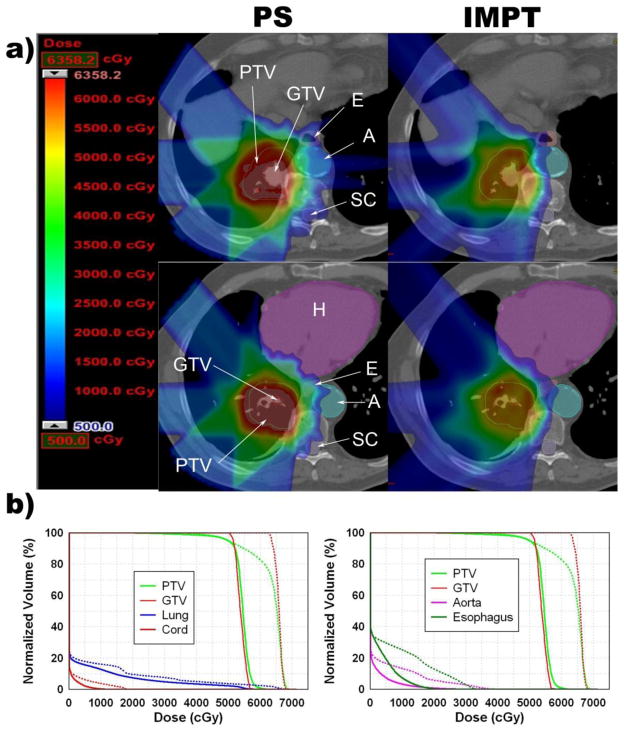
Figure 2.
Improvement of IMPT compared with PSPT SBRT for a tumor close to the bronchial tree, esophagus, heart, spinal cord and aorta. (a) Color wash dose distributions shown with corresponding scale; maximum determined by plan with lower PTVmax. In the IMPT images, the gray zone seen inside the PTV represents where the IMPT plan had a dose higher than the scale maximum. (b) Dose-volume histograms. Dotted lines = PSPT plan; solid lines = IMPT SBRT plan.

