Figure 4.
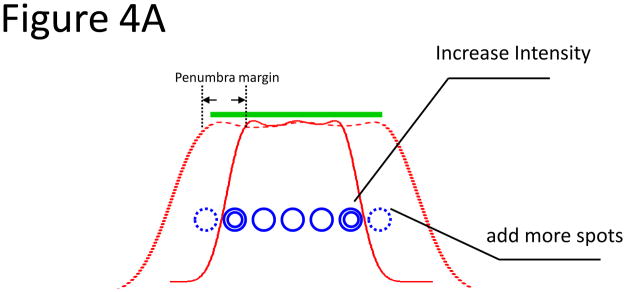
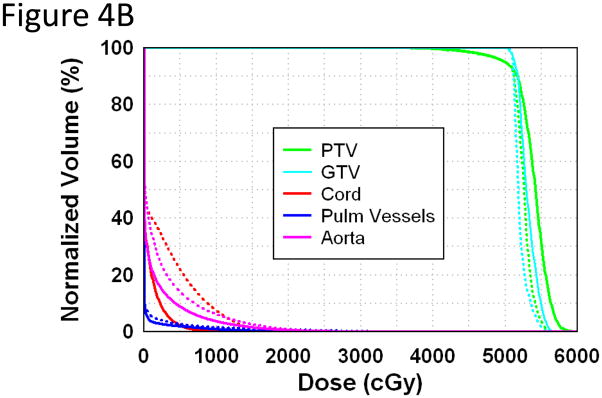
A. Illustration showing the concept of using intensity modulation to reduce the penumbra. The thick green line denotes the target to be uniformly covered, and the solid red curve shows the dose profile calculated using the spots denoted by the single blue circles. The green target was not adequately covered owing to inadequate penumbra margin. Two options were used to cover the target: (1) increase the number of spots at the edge, denoted by dashed blue circles (large penumbra margin), and (2) increase the intensity of the spots at the edge, denoted by the double circles (small penumbra margin). The red-dashed curve shows the dose profile that adequately covered the target using those 2 approaches. B. Application of the 2 approaches on patients who received proton SBRT. Dose volume histogram of a plan using a 1-cm lateral/penumbra margin (dashed line) and 0.2-cm lateral/penumbra margin (solid line).


