
Figure 3. CGB shapes ANG-II evoked Ca2+ release.
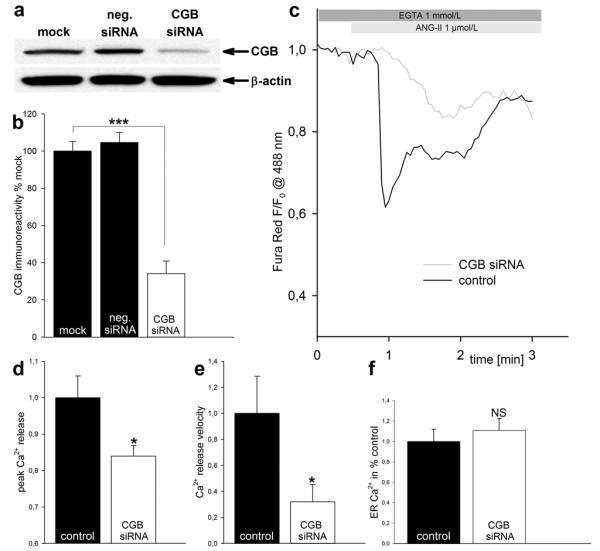
(a, b) Documentation of CGB knock-down. (a) Representative western blot. Note the decrease in CGB immunoreactivity in CGB knock-down cells only. (b) Quantification of CGB immunoreactivity by densitometry. (c) Representative traces. CGB knock-down decreases peak Ca2+ release and velocity of Ca2+ release upon ANG-II stimulation. (d, e) Quantification of peak Ca2+ release (d) and velocity of Ca2+ release (e). (f) CGB knock-down does not deplete ER-Ca2+ stores.