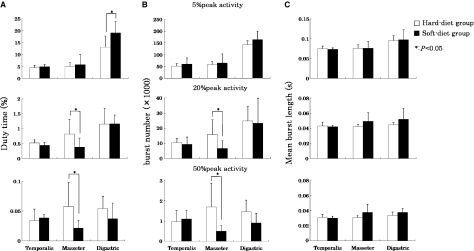
Fig. 2.
(A) Duty time (%), (B) burst number and (C) mean burst length (s) in hard-diet group (open) and soft-diet group (solid). Muscle activities exceeding 5, 20 and 50% of the peak electromyographic level for all tested muscles (superficial masseter, anterior belly of digastric and anterior temporalis muscles) are shown. Values are means + SD. *Significant differences between both groups (P < 0.05).

