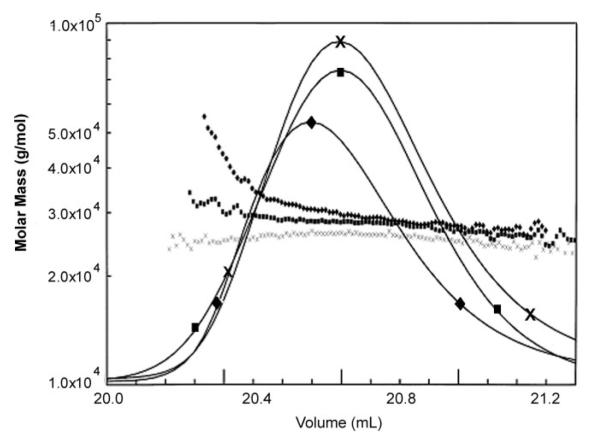
Fig.3. Npp:Npp interaction detected by size exclusion chromatography and light scattering.
Weight average molar mass plotted as a function of elution volume from TSK 3000SW column. Buffer conditions varied from low ionic strength, 75 mm (diamonds), physiological ionic strength, 175 mm (squares), and high ionic strength, 500 mm (×). Average molecular weight values are shown for the trailing and leading edges of chromatographic peaks.

