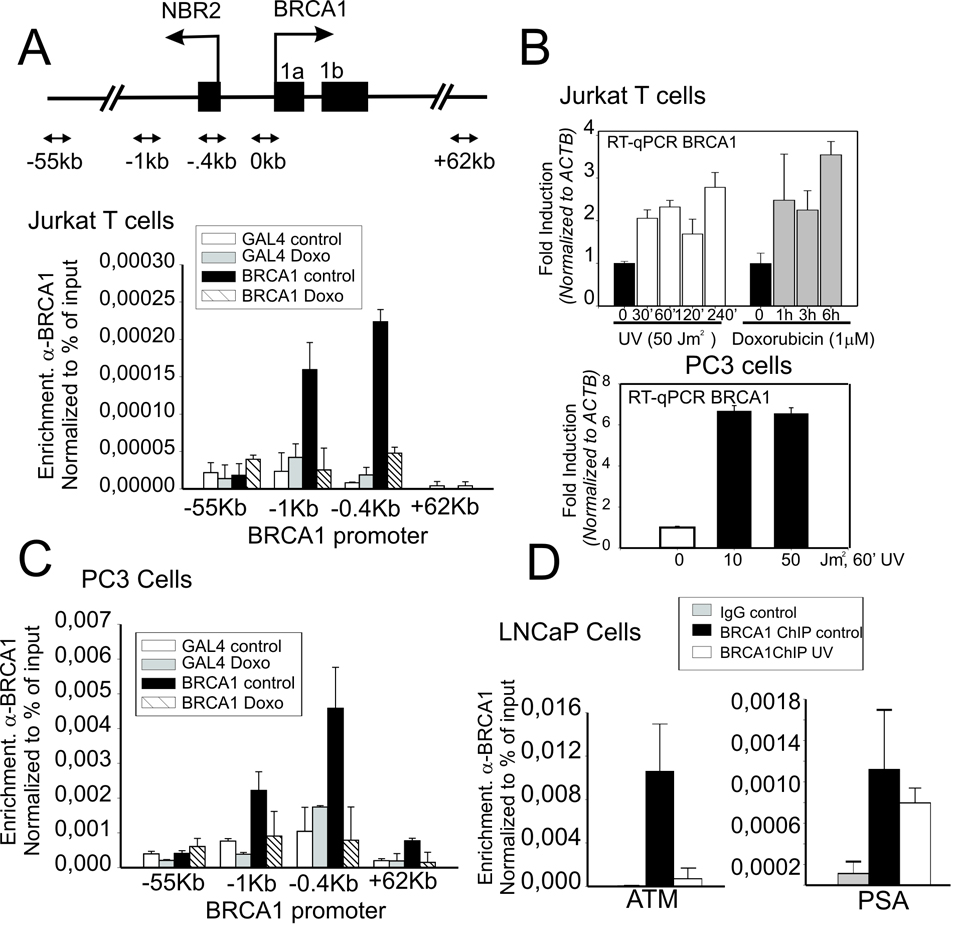
Figure 2. BRCA1 protein association with the BRCA1 promoter and BRCA1 expression is regulated by genotoxic stress.
(A) Inset above, schematic diagram of BRCA1 promoter show divergent NBR2 gene and relative positions of primers set used in this study. ChIP analysis at the BRCA1 promoter using BRCA1-specific or non-specific control IgG (α-Gal4) in untreated Jurkat T-cells or cells treated 3h with doxorubicin (1µM). Shown is enrichment at positions of the BRCA1 locus relative to the transcription start site presented as percent recovery of input. (B) Jurkat T cells or PC3 cells were treated with either UV or doxorubicin (1µM) and harvested at the indicated times prior to RNA isolation. Mature RNA message was determined by RT-qPCR normalized to ACTB. (C) ChIP analysis of BRCA1 binding to the BRCA1 promoter in PC3 human prostate cell lines at indicated positions relative to the TSS in untreated and Doxorubin treated cells (1µM, 24 h). IgG against yeast Gal4 α-Gal4 was used as a non-specific binding control. (D) ChIP analysis of BRCA1 binding to the ATM and PSA promoters in LNCaP cells untreated or after UV treatment. In all cases (1A, C and D) mean enrichment and error shown correspond to the average and standard deviation of two independent experiments.

