Figure 4.
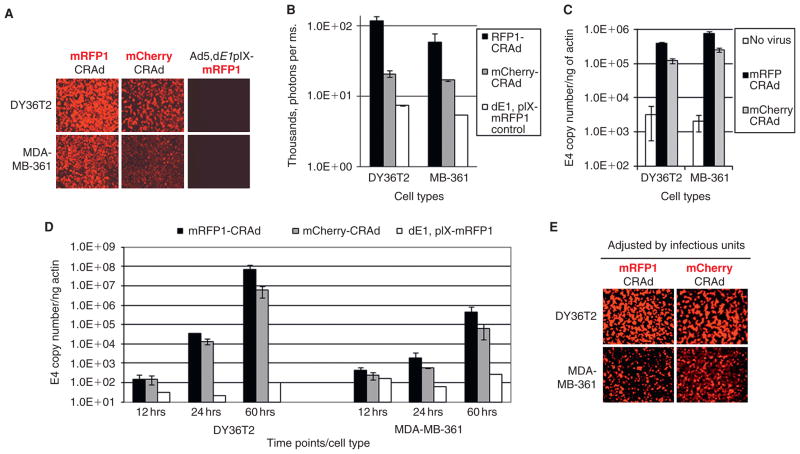
Biologic characterization of capsid-labeled CRAds in vitro by imaging and molecular methods. A, Fluorescence in DY36T2 and MDA-MB-361 cells was visualized by fluorescent microscopy (with 4× objective) 48 hours postinfection with either mCherry- or mRFP1-CRAd and incubation at 37°C. A capsid-labeled replication-defective virus Ad5, dE1, pIX-mRFP1 was used as a negative control for Ad replication. B, Quantification of fluorescence intensity in CRAd-infected cells from images shown on A by using Nuance 2.4.2 spectral imaging software. Fluorescent signals are presented as photons per millisecond (ms) of image exposure. C, Comparison of the labeled CRAds for their cell binding ability. An equal number of mRFP1- and mCherry-CRAd particles were used to infect either DY36T2 or MDA-MB-361 breast cancer cells in vitro for 1 hour at 4°C (multiplicity of infection [MOI] = 500 vp/cell). Total DNA was isolated from the cells for quantitative PCR analysis of the Ad5 genomic DNA (E4) copy number and the housekeeping β-actin gene for normalization. CRAd-infected cell samples were analyzed in triplicates. D, Comparison of the CRAd DNA replication in vitro. Each cell line was infected with an equal number of viral particles of either mRFP1- or mCherry-CRAds at an MOI of ≈100 vp/cell, and total DNA was harvested 12, 24, and 60 hours later. The rest of the analysis was the same as described for C. CRAd-infected cell samples were analyzed in triplicates. Black and gray bars correspond to mRFP1- and mCherry-CRAds, respectively. White bars correspond to replication-defective control virus dE1, pIX-mRFP1. Standard deviation is shown by brackets on all charts. All graphs are presented in log scale. E, Fluorescence microscopy analysis of intracellular fluorescence, similar to the one shown in A, except equal infectious units (TCID50 units) of each CRAd were used. Specifically, six times more viral particles of the mCherry-CRAd was used for infection to correlate infectious particles with produced cell fluorescence during the linear phase of CRAd replication in vitro. Images were taken between 48 and 60 hours postinfection.

