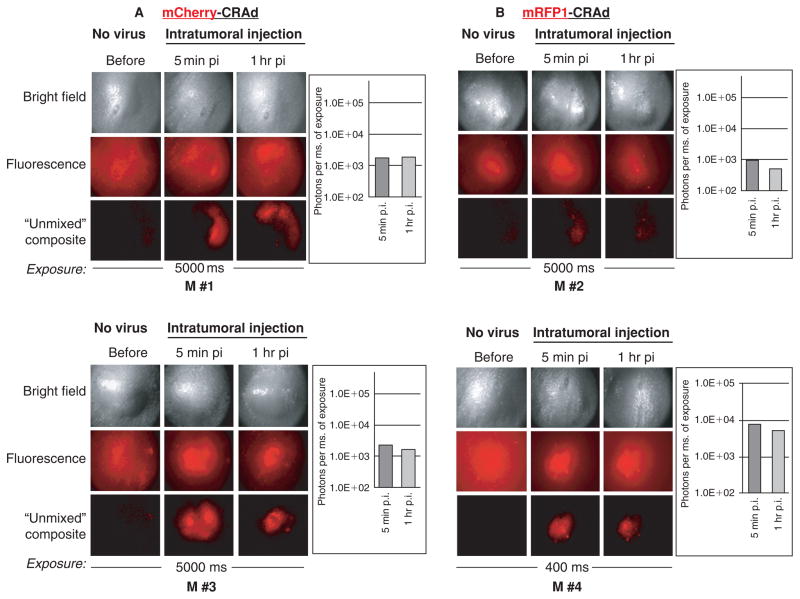
Figure 5.
Direct visualization of labeled viral particles in xenograft tumors. An equal number of purified viral particles (3 × 10¹⁰ vp in 10 μL of saline) of capsid-labeled mCherry-CRAd (A) or mRFP1-CRAd (B) were delivered into mammary fat pad tumors orthotopically implanted in athymic nude mice by a single intratumoral injection. Sample images of four representative tumors (M #1–M #4) are shown to reflect signal variability. Images were captured before and 5 minutes or 1 hour after injection of labeled viruses at 5,000 or 400 milliseconds (M #4) exposure. Signals on original unsaturated fluorescent images were quantified (bar graphs) using Nuance 2.4.2 spectral imaging software, as described in Materials and Methods. Unmixed composite images are the result of digital processing of the original (fluorescence) images by subtracting fluorescence components with spectral profiles, distinct from those of fluorescent proteins (mRFP1/mCherry). Bright field panels represent phase contrast images of the same tumors. Exposure times in milliseconds (ms) are indicated below each figure panel. M #1 to M #4 indicate names of the tumors/mice within each experimental tumor group, whose replication profiles are depicted in Figure 6. M #1 and M #3 belong to DY36T2 tumor groups; M #2 and M #4 belong to the MDA-MB-361 tumor groups; M #1 and M #3 received injection of the mCherry-CRAd; M #2 and M #4 were injected with the mRFP1-CRAd.

