Figure 6.
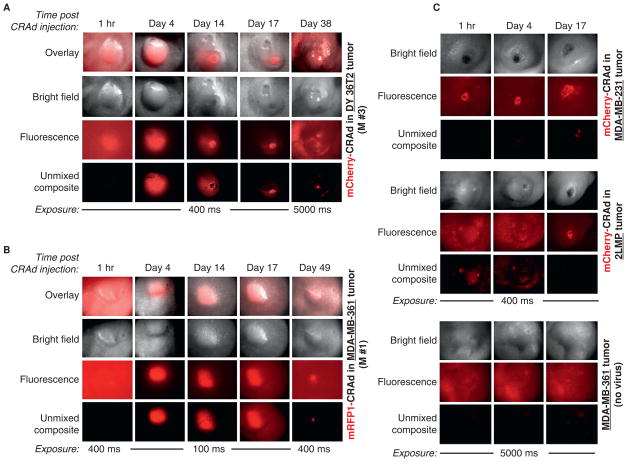
Noninvasive tracking of CRAd replication in tumors by spectral imaging. Arrays of images of representative mammary fat pad DY36T2 (A) or MDA-MB-361 (B) tumors showing dynamic changes in the tag-specific red fluorescence in the course of intratumoral replication of the labeled CRAds. Repetitive spectral imaging of the same tumors (corresponding to the M #3 and M #1 charts on Figure 7, A and D, respectively) was performed before (1 hour) and after (days 4–49) the onset of viral replication. All types of tumors received intratumoral injection of the same dosage (viral particles) of mCherry- (A, C) or mRFP1-CRAd (B). Overlay (bright field plus fluorescence) images were made by using Adobe Photoshop C2 software. Other details are as in Figure 5. C, Representative images of other types of breast cancer tumors MDA-MB-231 and 2LMP with a substantially lower permissiveness to the CRAd infection and weaker fluorescence (top and middle panels), following injection with the same dose of mCherry-CRAd as in A and B, at indicated time points. Representative images of a single MDA-MB-361 tumor that received no CRAd are shown as control for autofluorescence. Bright foci on original images represent autofluorescence of ulcerated (wounded) areas on the surface of some tumors.

