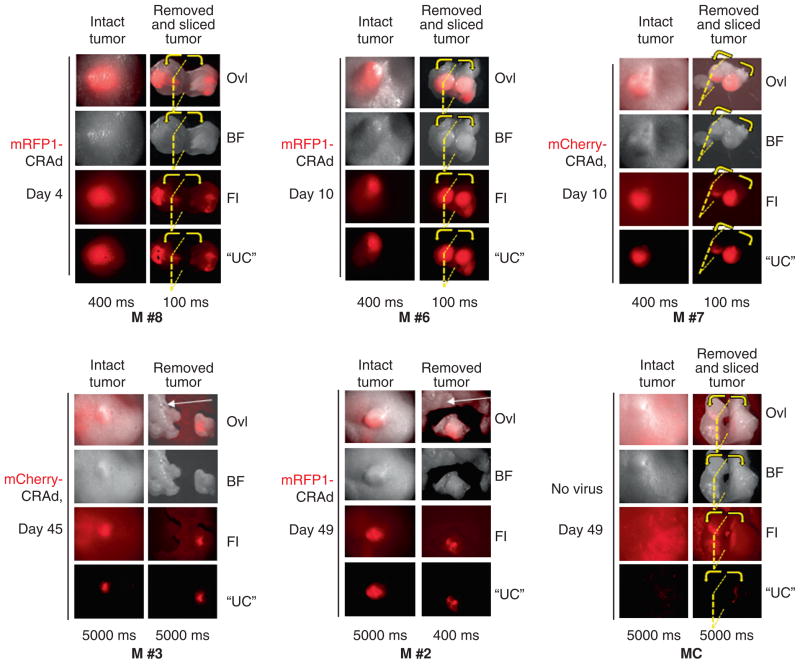
Figure 8.
Ex vivo analysis of isolated and sliced tumors by spectral imaging. Fluorescent signals in tumors were analyzed by spectral imaging before and after surgical removal and slicing of the tumors. Images taken noninvasively (“intact tumor”) are shown on the left-side columns of each image panel. Images of the same tumors after their surgical removal (panels M #2 and M #3) or both removal and slicing (panels M #6, M #7, M #8, MC) are shown on the right-side columns (“removed tumor” or “removed and sliced tumor”) for signal comparison. Images of six representative tumors (M #2, M #3, M #6, M #7, M #8, MC) surgically removed at different time points (day 4, day 10, and day 45/49) are displayed. Tumor cross-section plane is shown by a yellow dotted line, and the direction of the slice separation is indicated by yellow arrows. All shown tumors are of MDA-MB-361 cell origin. A tumor that did not receive any virus was used as autofluorescence control (panel “MC”). Exposure times in milliseconds are indicated below each image column. Shorter exposures are shown for cross-sections or some isolated tumor images (M #2) to avoid signal saturation. Tissues of nontumor origin shown for autofluorescence level comparison are indicated by white arrows (panels M #2 and M #3). BF = bright field images; Fl= fluorescence images; Ovl = overlay; “UC” = “unmixed composites”. Other details as in Figure 5 and Figure 6. Panels M #6, M #7, and M #8 display images of additional tumors of the MDA-MB-361 experimental groups dissected early in the experiment (day 4 or day 10 time point). Tumors M #2, M #6 and M #8 received mRFP1-CRAd; tumor M #3 and M #7 received mCherry-CRAd.

