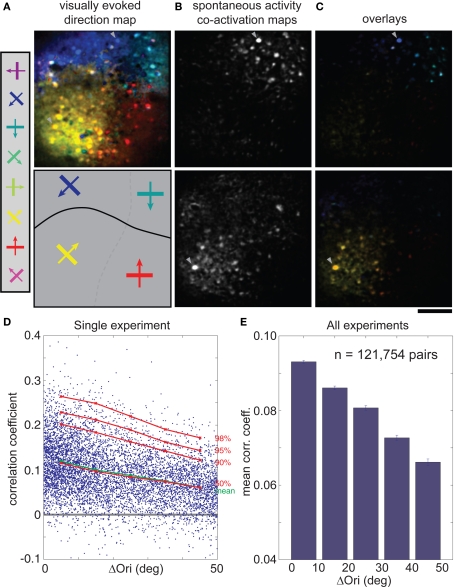
Figure 4.
Correlations in spontaneous activity is greatest for cells with similar orientation or direction preference in cat visual cortex. (A) Top, direction map where hue is determined by the direction that evoked the strongest response when stimulated with eight directions of motion. Bottom, schematic diagram of orientation and direction domains (solid line: fracture between domains with opposite direction preference). (B) Co-activation maps (ΔF), obtained during spontaneous activity, for two different trigger cells (arrowheads). (C) Overlay of the single direction map (A) with the two different co-activation maps (B). Note that co-active cells share the same orientation and direction preferences (hue). (D) CC for each cell pair plotted against their difference in orientation preference (ΔOri) for a single experiment. Mean CC, green; 50th to 98th percentiles, red. (E) Mean spontaneous CC vs. ΔOri over all experiments (n = 121,754 cell pairs, six cats). Error bars, SEM. Scale bars, 100 μm. ΔOri is limited to a maximum of 50° because there were few cell pairs with ΔOri above that value.

