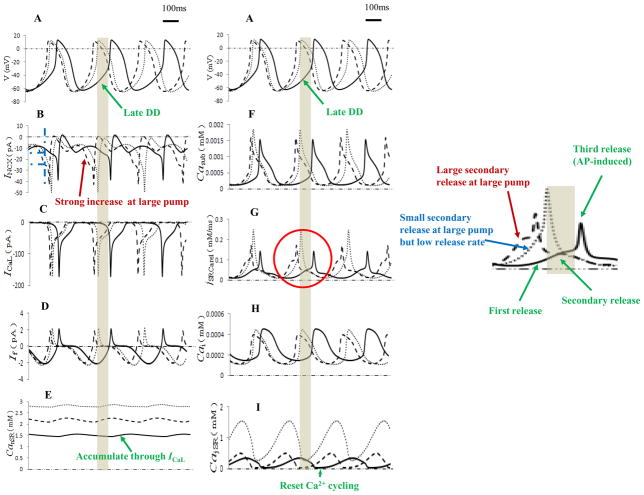
Figure 2.
Simulation traces of the primary dynamic interactions of the M clock and Ca2+ clock during spontaneous production of action potential. Action potentials, major ionic currents and Ca2+ behaviors in different compartments were shown. Solid curves denoted the baseline (Pup =12mM/s, Ks =250/μs). Dashed curves were under the high SERCA pump rate (Pup =20mM/s, Ks =250/μs) while dotted curves corresponded to the high SERCA pump but low Ca2+ release rate (Pup =20mM/s, Ks =12.5/μs). Grey bars indicated the period of late DD under the baseline conditions. The jSRCarel curves inside the red circle were enlarged at the right side.

