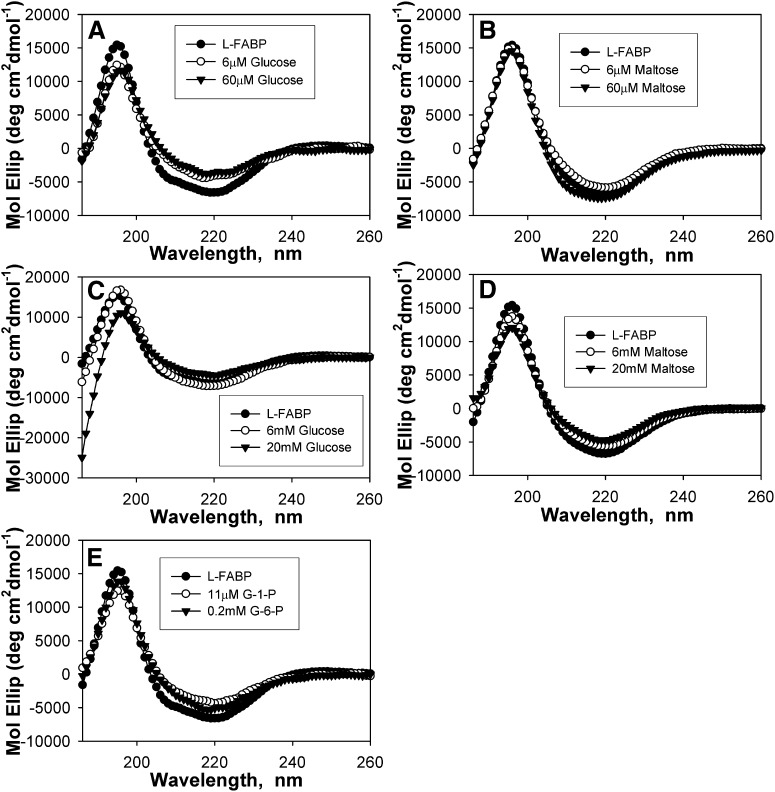
Fig. 2.
Binding of glucose and glucose metabolites alters L-FABP secondary structure. Far UV (UV) circular dichroic (CD) spectra of 2.4 μM L-FABP in the absence (A-E, •) and presence of 6 μM glucose (A, ○); 60 μM glucose (A, ▾); 6 μM maltose (B, ○); 60 μM maltose (B, ▾); 6 mM glucose (C, ○); 20 mM glucose (C, ▾); 6 mM maltose (D, ○); 20 mM maltose (D, ▾); 11 μM G-1-P (E, ○); and 0.2 mM G-6-P (E, ▾). Each spectrum represents an average of 10 scans for a given representative spectrum, n = 3–6. G-1-P, glucose-1-phosphate; G-6-P, glucose-6-phosphate; L-FABP, liver fatty acid binding protein.

