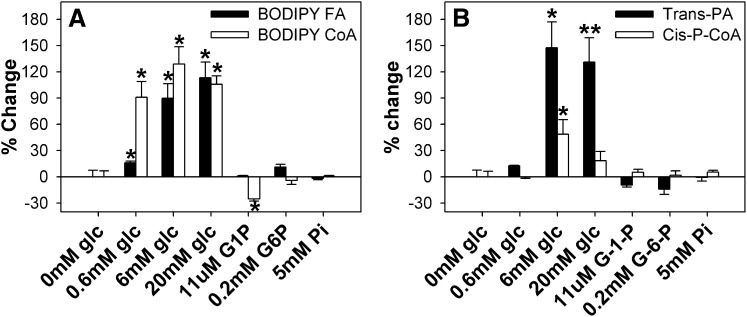
Fig. 3.
Glucose increases L-FABP binding capacity for LCFA and LCFA-CoA. (A) L-FABP (100 nM) was mixed with 50 nM BODIPY C-16 (▪) or BODIPY C16-CoA (□), and fluorescence intensities were measured at 490–540 nm upon excitation at 460 nm. (B) L-FABP (100 nM) was mixed with 50 nM trans-parinaric acid (▪) or cis-parinaroyl-CoA (□), and the fluorescence intensities were measured at 380–450 nm upon excitation at 317 nm. After the initial fluorescence measurements (0 mM glucose) were obtained, glucose or glucose metabolites were added, and fluorescence intensities measured to determine the effect of glucose on lipid binding. All values are presented as the mean percent change in maximal fluorescence intensity (n = 4) ± SEM. Asterisks (*) indicate significant differences from the 0 mM glucose controls; P < 0.05. G-1-P, glucose-1-phosphate; G-6-P, glucose-6-phosphate; L-FABP, liver fatty acid binding protein; LCFA, long-chain fatty acid; LCFA-CoA, long-chain fatty acyl-CoA.

