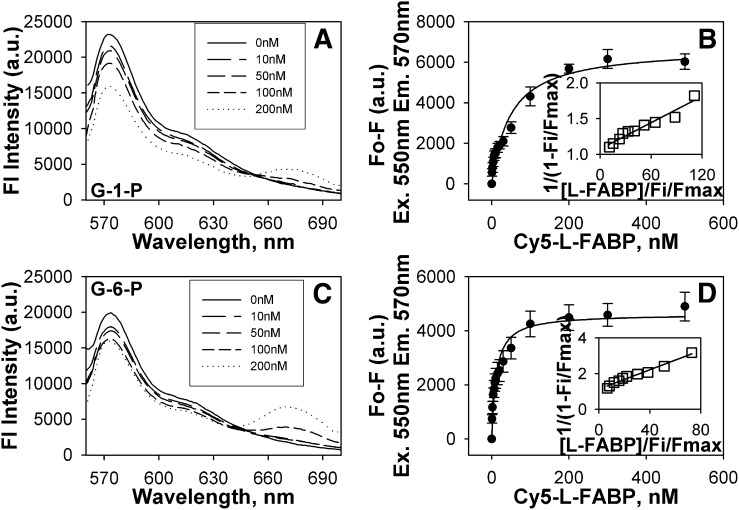
Fig. 7.
Glucose metabolites oppositely affect fluorescence resonance energy transfer. FRET from donor Cy3-labeled PPARα to acceptor Cy5-labeled L-FABP was detected as quenching of Cy3 fluorescence emission (near 570 nm) and the concomitant appearance of sensitized emission from Cy5 (near 680 nm). Emission spectra of Cy3-PPARα and Cy5-L-FABP upon excitation of Cy3 at 550 nm in the presence of 11 μM G-1-P (A) and 0.2 mM G-6-P (C) titrated with increasing Cy5-L-FABP concentrations (solid line, 0 nM; larger dashes to dots, 10 nM, 50 nM, 100 nM, and 200 nM Cy5-L-FABP, respectively). Plot of the average change in maximal fluorescence intensity at 570 nm (F0-F) of Cy3-PPARα upon excitation at 550 nm as a function of Cy5-L-FABP concentration (with the inset referring to a linear plot of the binding curve) in the presence of 11 μM G-1-P (B) and 0.2 mM G-6-P (D). Values represent the mean ± SE, n = 4. FRET, fluorescence resonance energy transfer; G-1-P, glucose-1-phosphate; G-6-P, glucose-6-phosphate; L-FABP, liver fatty acid binding protein; PPAR, peroxisome proliferator-activated receptor.

