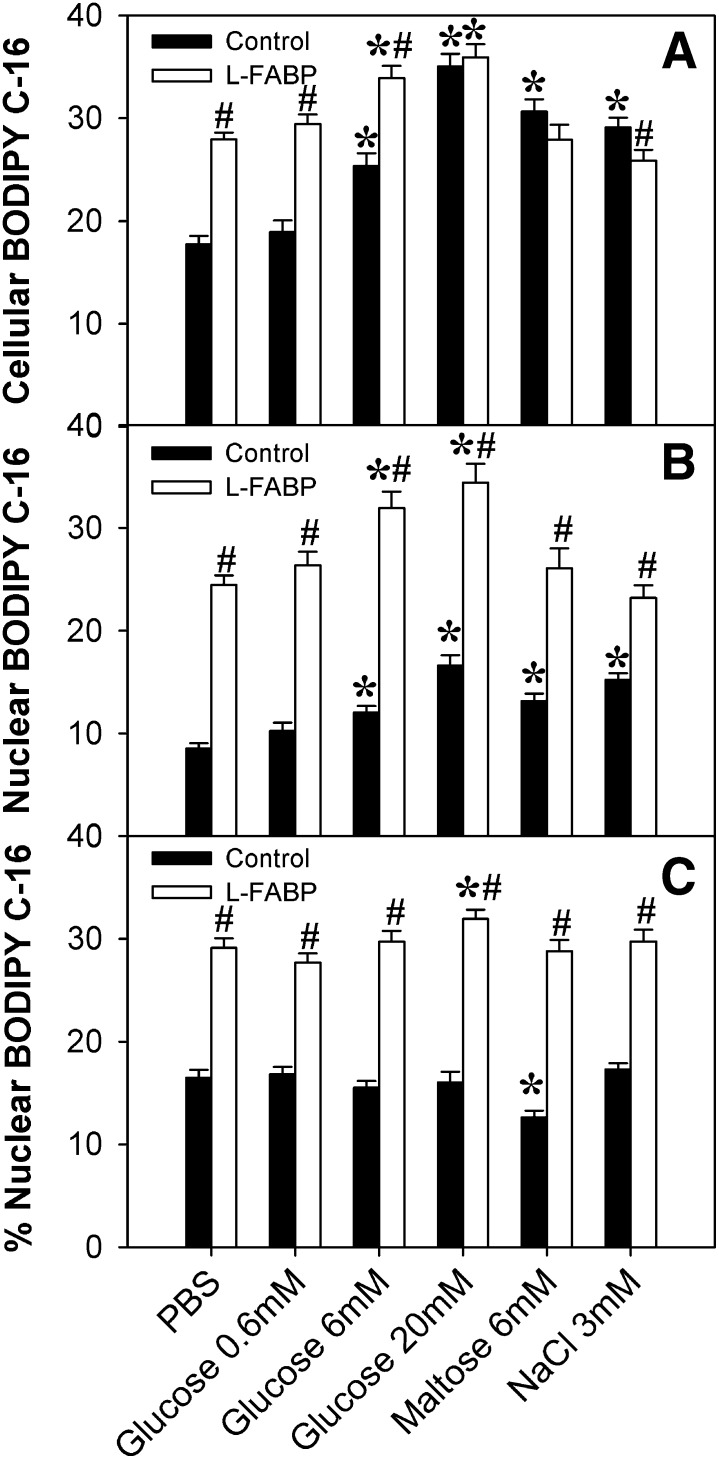
Fig. 9.
L-FABP expression and addition of glucose synergistically increase BODIPY C-16 uptake and nuclear concentrations of BODIPY C-16 in a concentration-dependent manner. (A) Cellular BODIPY C-16 fluorescence from control (□) and L-FABP-expressing (▪) L-cells was calculated per cell by taking the BODIPY C-16 fluorescence intensity of the whole cell divided by the area of the whole cell (to compensate for variation due to cell size); these values were then averaged over n = 50–100 cells. (B) Using the Syto59 fluorescence, the nuclear perimeter was marked, allowing for analysis of the BODIPY C-16 levels in the nucleus. Nuclear BODIPY C-16 fluorescence from control (□) and L-FABP-expressing (▪) L-cells was calculated per nucleus by taking the BODIPY C-16 fluorescence intensity of each nucleus divided by the area of the nucleus (to compensate for variation due to cell size); these values were then averaged over n = 50–200 cells. (C) The percentage of BODIPY C-16 localizing to the nucleus, calculated by dividing the total BODIPY C-16 fluorescence in the nucleus by the total fluorescence in the whole cell and multiplying by 100%. Values are presented as the mean value ± SEM, from 50–100 cells from two to three separate replicates. Asterisks (*) indicate significant differences from the 0 mM controls; P < 0.05. Pound symbols (#) indicate significant differences due to the presence of L-FABP compared with wild-type cells under the same conditions; P < 0.05. L-FABP, liver fatty acid binding protein.

