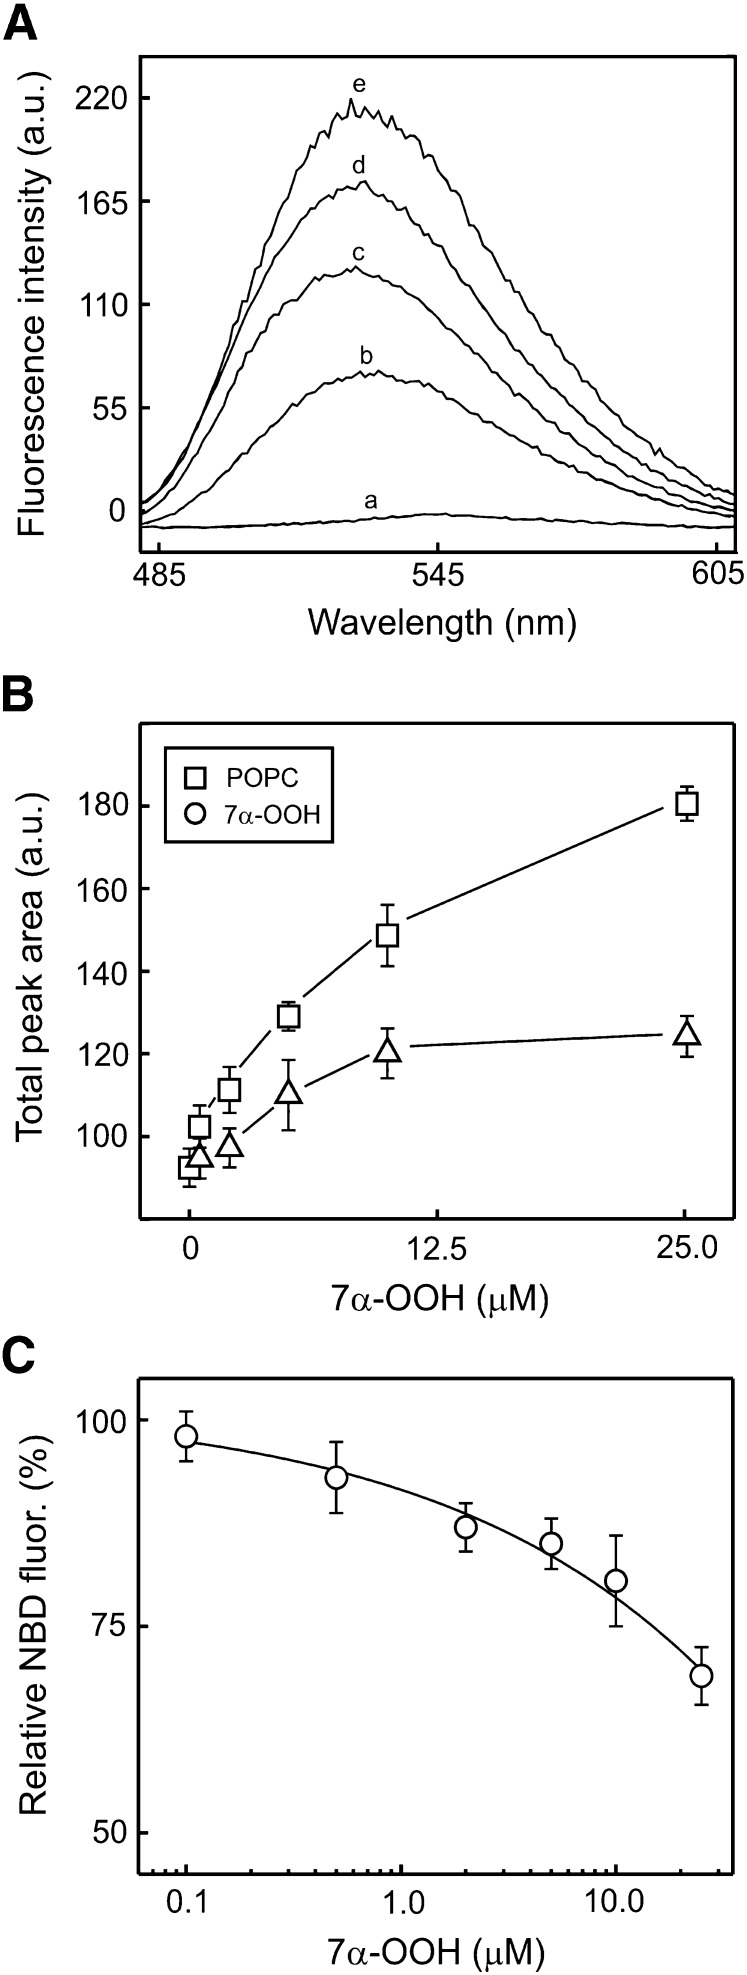
Fig. 10.
Competition between SCPI and liposomal 7α-OOH for binding to isolated SCP-2. A: Fluorescence emission spectra of 1.25 µM NBD-Ch in the presence of the following other components: (a) none; (b) 10 µM 7α-OOH in POPC/7α-OOH/DCP (79:20:1 by mol) SUV form; (c) 5 µM SCP-2; (d) 5 µM SCP-2 plus 10 µM 7α-OOH in SUV form; (e) 5 µM SCP-2 plus 10 µM POPC in POPC/DCP (99:1 by mol) form. NBD-Ch (1.25 µM) plus 10 µM POPC in SUV form gave a spectrum (not shown) that was virtually identical to that of (b). B: Fluorescence peak areas for conditions (d) and (e) in panel A plotted as a function of 7α-OOH concentration over the 0.5-25 µM range (Δ). The POPC plot (□) represents total lipid concentrations for the given range of peroxide concentrations; for example, at 10 µM 7α-OOH, total lipid was 50 µM, as 7α-OOH was 20 mol % of the SUV lipid. C: Replotted panel B data showing NBD-Ch fluorescence in the presence of SUV-7α-OOH relative to that in the presence of total SUV lipid, as a function of 7α-OOH concentration. Values in B and C are means ± SD (n = 3).

