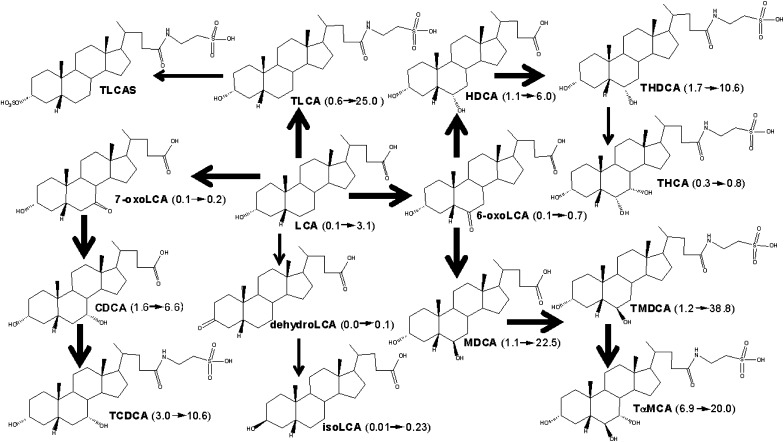
Fig. 7.
A scheme showing proposed metabolic pathways for LCA in mice. The dark arrows indicate the major metabolic pathway. The number in the parenthesis indicates the average concentration of individual BAs in mouse livers. LCA (0.1→3.1) means that LCA was increased from 0.1 to 3.1 nmol/g in livers of male mice fed LCA. BA, bile acid; CDCA, chenodeoxycholic acid; HDCA, hyodeoxycholic acid; LCA, lithocholic acid; MDCA, murideoxycholic acid; TCDCA, taurochenodeoxycholic acid; THCA, taurohyocholic acid; THDCA, taurohyodeoxycholic acid; TLCA, taurolithocholic acid; TLCAS, taurolithocholic acid sulfate; TαMCA, tauro-α-muricholic acid; TMDCA, tauromurideoxycholic acid.

