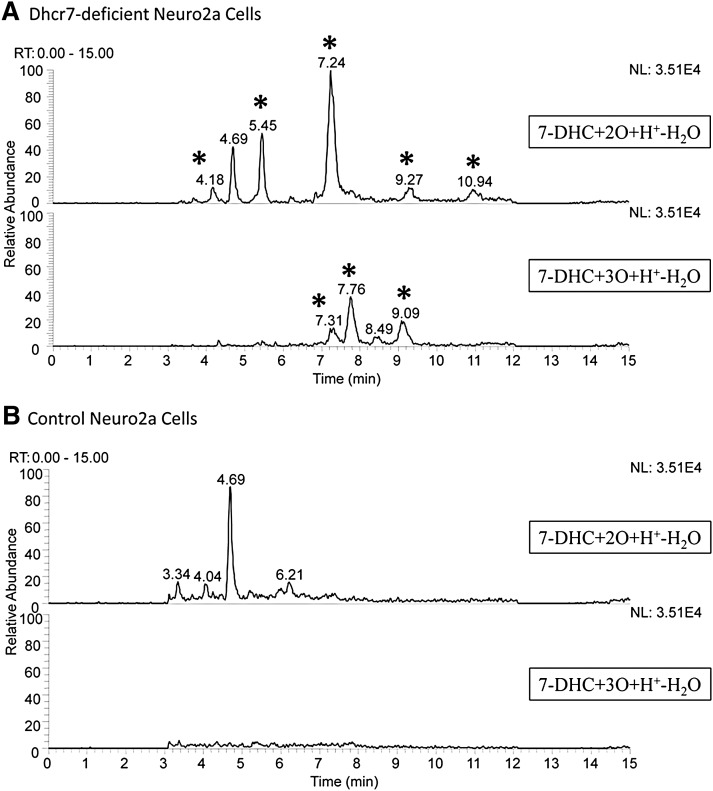
Fig. 1.
7-DHC oxysterols are present in Dhcr7-deficient Neuro2a cells. The chromatogram in panel A shows the oxysterol profile of Dhcr7-deficient Neuro2a cells. New peaks relative to control (B) are marked with an asterisk. The peak at RT = 4.69 min represents a minor MS fragment from the external standard 25-hydroxycholesterol.

