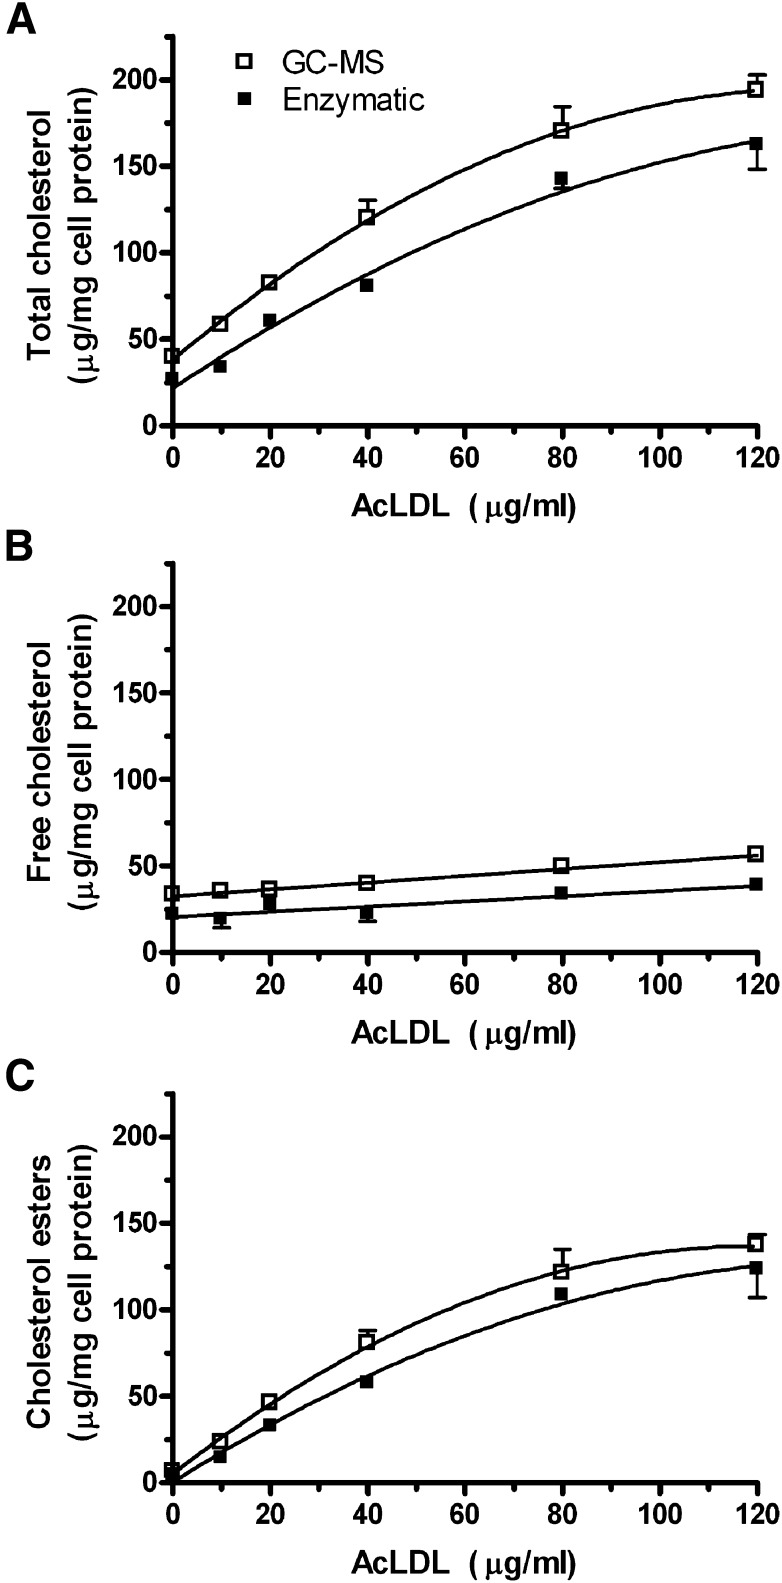
Fig. 3.
Comparison of the enzymatic and GC-MS methods at varying levels of cholesterol loading in RAW 264.7 mouse macrophages. Cells were incubated with increasing concentrations of AcLDL and their total cholesterol (A), free cholesterol (B), and cholesterol esters (C) levels were measured by both the enzymatic (filled squares) and the GC-MS (open squares) methods, using the dual internal standard strategy described in the Methods section. Each symbol represents the mean ± SD of two wells.

