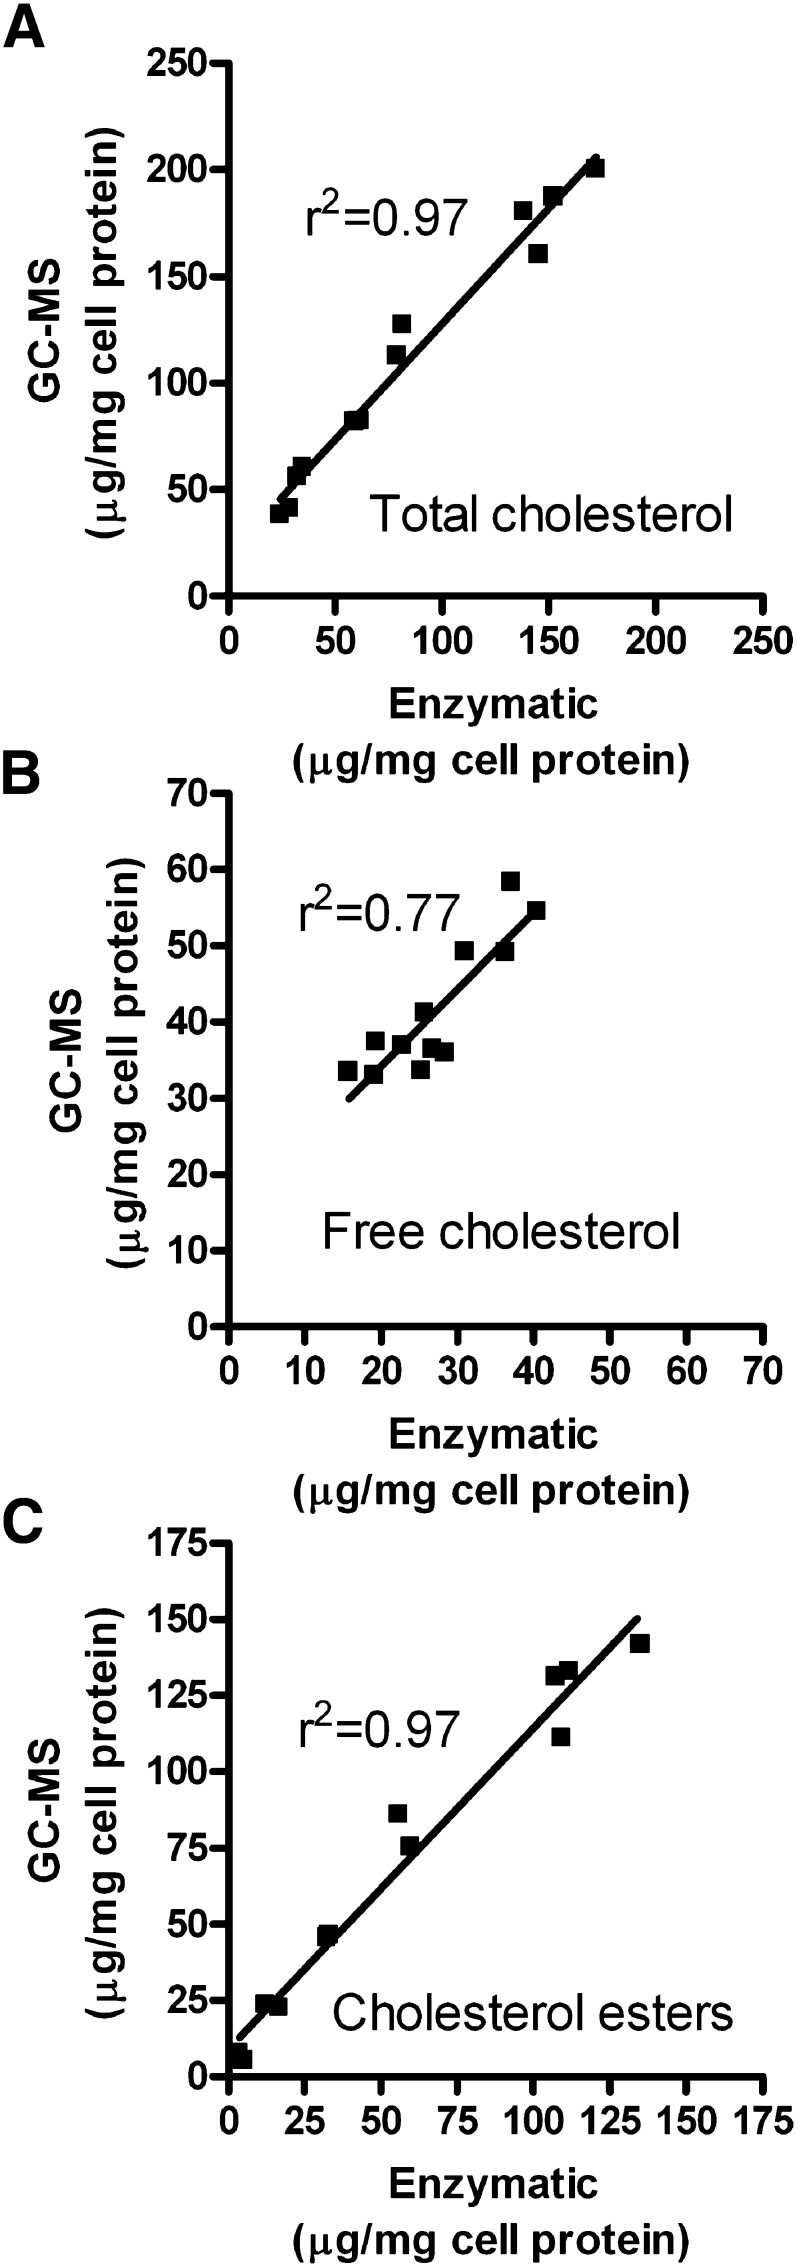
Fig. 4.
Correlation analysis of cholesterol values obtained by the enzymatic and GC-MS methods. The data plotted are derived from the 12 independent wells of cells that contain a range of cholesterol levels as described in the legend of Fig. 3. A: Total cholesterol levels (r2 = 0.97, slope = 1.08 ± 0.06; y-intercept = 19.3). B: Free cholesterol levels (r2 = 0.77, slope = 1.01 ± 0.17; y-intercept = 13.8). C: Cholesterol esters levels (r2 = 0.97, slope = 1.05 ± 0.06; y-intercept = 9.0).

