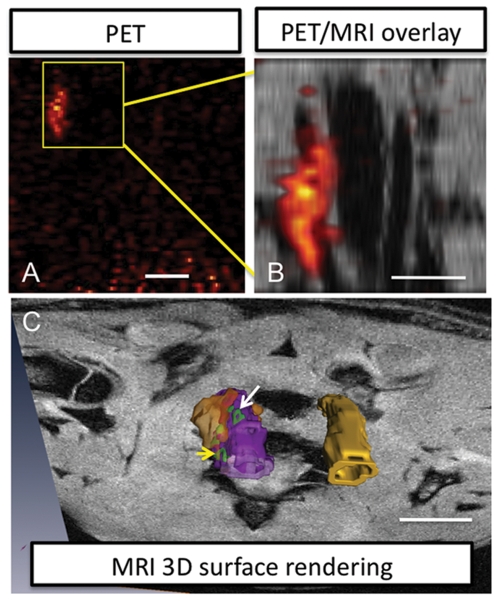
Figure 2. Multimodal macromolecular probes accumulate in the injured vessel of the rat carotid clamp injury model.
(A) Coronal view PET image of the rat thorax shows a region of high signal intensity indicating probe accumulation in macrophages, however it is difficult to interpret the tissue of origin for the signal without anatomical information. Scale bar = 20 mm (B) “Zoomed in” MR images for the volume indicated by the boxed area in A reveal that the PET signal correlates to the carotid artery on the left. Scale bar = 5 mm. This vessel also shows elevated MR contrast and thicker vessel walls compared to the vessel on the right, (C) 3D reconstruction of MRI and PET data from the carotids is shown protruding from a plane in the MR image. This view illustrates that the probes are localized to the vessel wall of the injured carotid artery (purple), MR signal intensities elevated relative to vessel background signal are rendered in green, and PET intensities are in orange. The contralateral uninjured vessel is yellow. Images rendered by segmentation. MRI high contrast region, in green donut shape, at white arrow is 0.6×1.8 mm (volume is 0.4×2.6×0.6 mm3; volume includes regions out of view in this 2D image). MRI high contrast signal at yellow arrow, in green horseshoe shape, is 0.8×1.2 mm, each arm is ∼0.2 mm wide (volume is 1×0.22×3.8 mm3). PET volume (orange) is 4.5×8.3×4.0 mm3. Scale bar = 5 mm.

