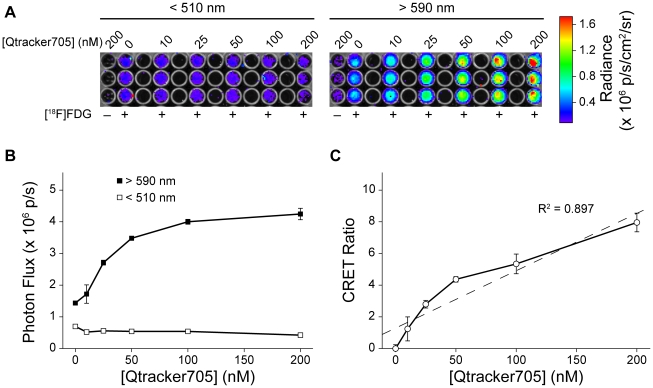
Figure 2. CRET in vitro was dependent on Qtracker705 nanoparticle concentration.
(A) IVIS 100 images of 96-well assay plates using either a <510 nm filter (left) or a >590 nm filter (right). Note the red “hot pixel” from an annihilation event detected by the CCD camera in one image (left), and the presence of minimally detectable CRET emitted from the wells containing 200 nM Qtracker705, but no [18F]FDG, due to contaminating radioactive emissions from adjacent wells (right). Qtracker705 nanoparticles show no CRET when imaged in isolation in the absence of [18F]FDG. (B) Plot of photon flux from either the <510 nm filter (□) or the >590 filter (▪) with increasing concentrations of Qtracker705 nanoparticles. (C) Plot of CRET ratios versus concentration of Qtracker705 nanoparticles (dashed line is a linear fit of the data: y = 0.036x+1.3; R2 = 0.897).

