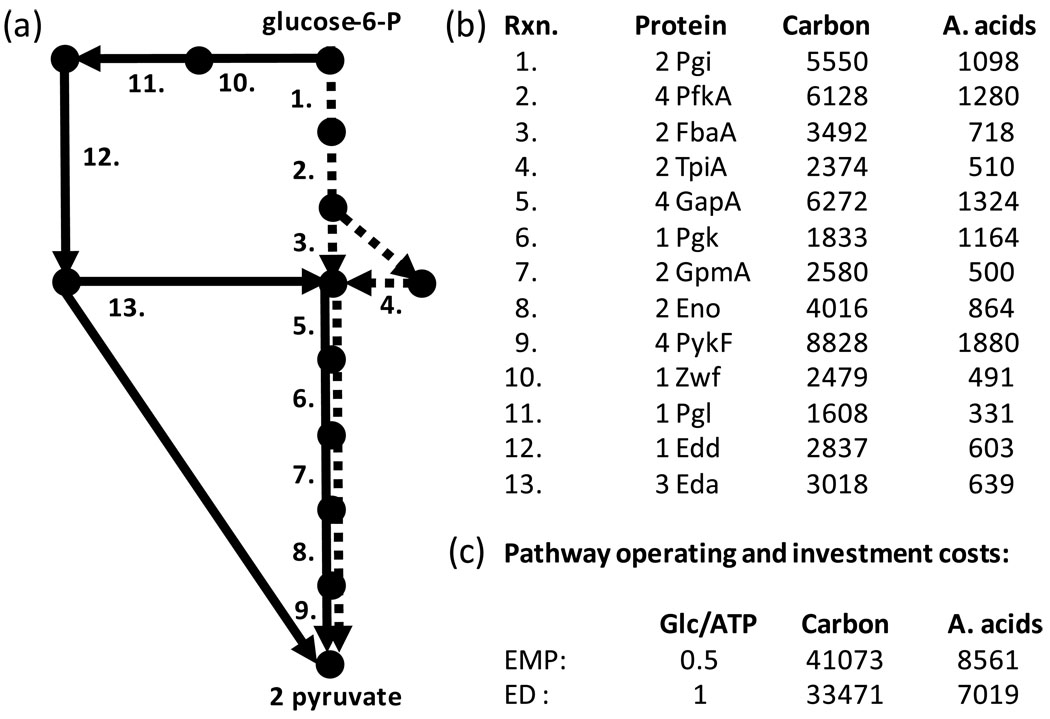
Figure 2. Comparison of resource investment requirements and metabolic efficiency of two glycolysis pathways.
(a) Schematic diagram of biochemical pathways converting glucose-6-P to 2 pyruvate molecules. Nodes represent metabolites, dashed lines represent enzymes associated with Embden-Meyerhof-Parnas (EMP) pathway, and solid lines represent enzymes associated with Entner-Doudoroff (ED) pathway. Numbers refer to enzymes listed at right. (b) Enzyme identifier and resource investment requirements for E. coli K12. Protein column lists the subunits composing each functional enzyme. Carbon and A. acids columns list the total number of carbon atoms and amino acids required for a complete subunit set. (c) Pathway tradeoff quantification based on ATP production and resource investment. Glc/ATP is the moles of glucose required to produce a mole of ATP during the conversion of glucose to 2 pyruvate. Carbon and A. acids columns list the summed pathway resource investments in terms of carbon atoms and amino acids respectively.

