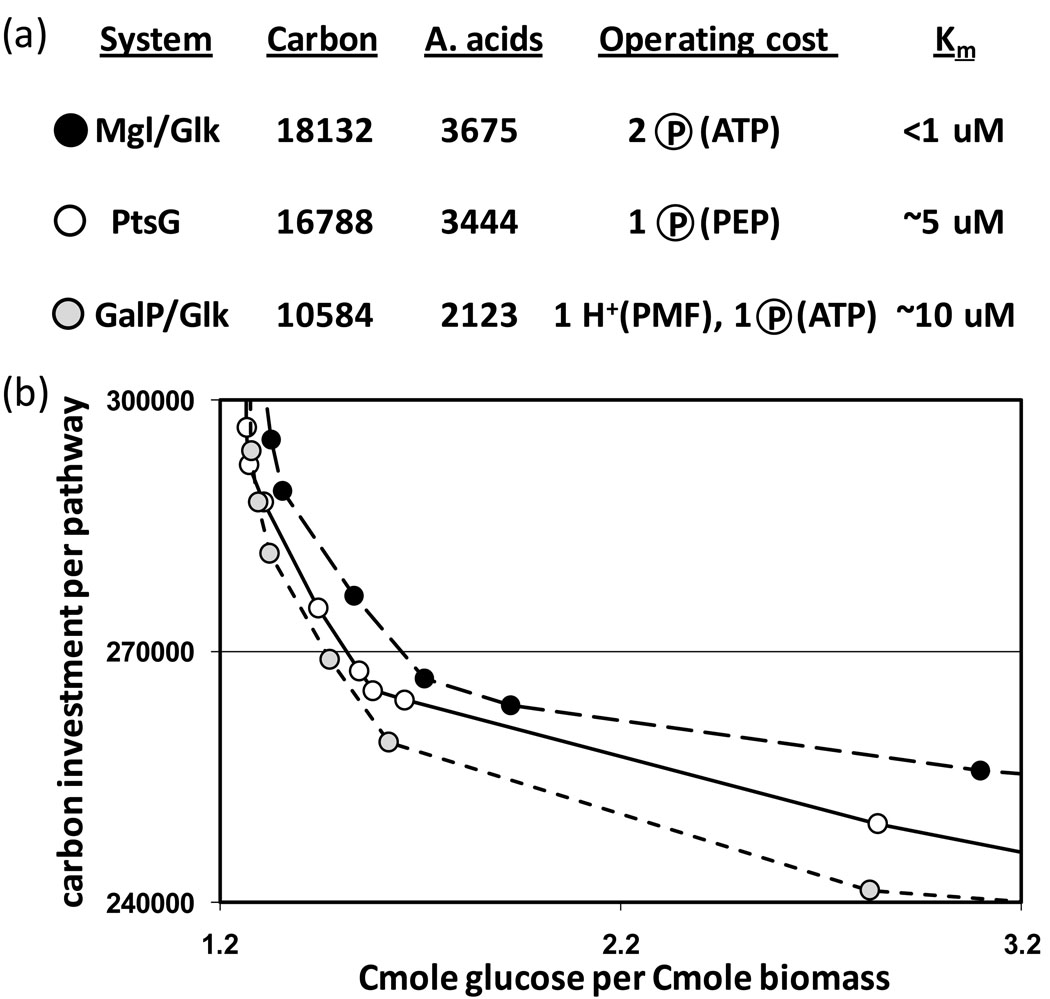
Figure 3. Opportunity costs associated with three separate E. coli glucose transport and phosphorylation systems.
(a) Carbon and amino acid investment requirements and operating costs for transport and phosphorylation of glucose. The glucose affinity is reflected in the Michaelis-Menten constant (Km); lower values correspond to higher affinities. Circled ‘P’ represents a high-energy phosphate bond, and PMF indicates proton motive force (1 H+ = ~0.3 ATP). (b) Tradeoff curves for growth utilizing each glucose transport system. The curves, derived from elementary flux mode analysis, account for carbon investment in central metabolism enzymes (Carbon per pathway, y-axis) and the corresponding biomass production efficiency (Cmoles of glucose consumed per Cmole biomass produced). The points on each curve are color-coded to correspond with the transport systems from (a). The opportunity costs to produce and operate higher affinity systems are shown by the vertical and horizontal distances, respectively, between the tradeoff curves. Note that opportunity costs increase with more severe investment limitation. This is a result of increased glucose intake to accommodate less efficient (but cheaper) enzymatic machinery. Diagram adapted from [25]. Data did not include maintenance energy expenditures.

