
Figure 5.
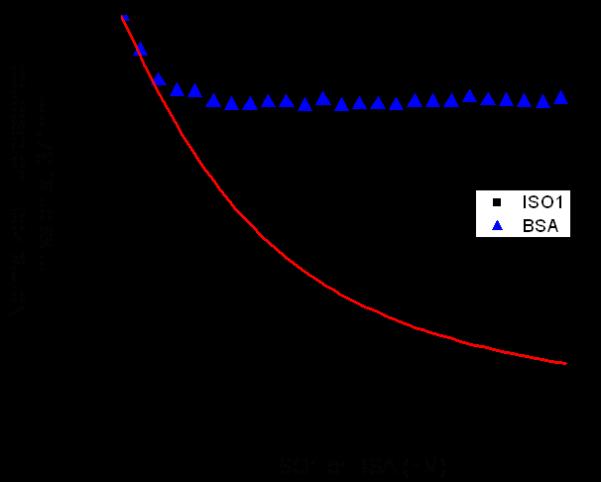
Fluorescence spectroscopy assay where FMRP ISO1 (black squares) is titrated into a fixed concentration of S3F-sh_8AP mRNA resulting in a Kd of 104 ± 11 nM and R2 value of 0.995. The Kd value was obtained by curve-fitting (red curve) the titration data points with equation 1. As a negative control, BSA (blue triangles) was similarly titrated and showed no significant binding to S3F-sh_8AP mRNA.