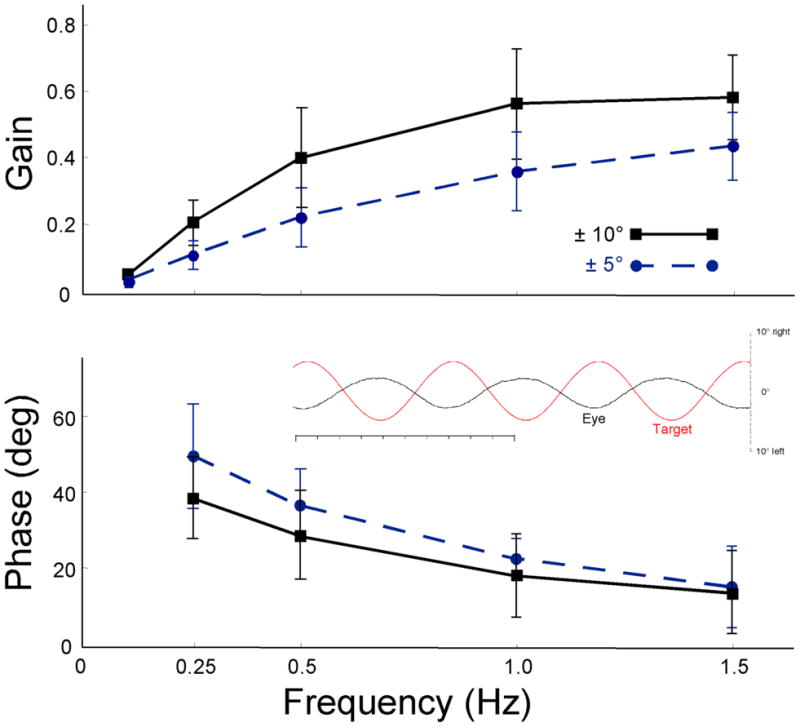
Figure 6.

Overall average VOR Bode plots. Gain (upper) and phase lead re chair (lower) as a function of frequency for ± 10° (solid black) and ± 5° (dashed blue). Error bars are standard deviations (SD) for repeated measures (3–6 repetitions) on 4–5 mice. Inset: exemplary raw records of vor at 1.5 Hz, ± 5°. Target (red) and eye (black), scale on right. Upward deflection is rightward. Time scale is 1.0 s total in 100 ms tic marks.
