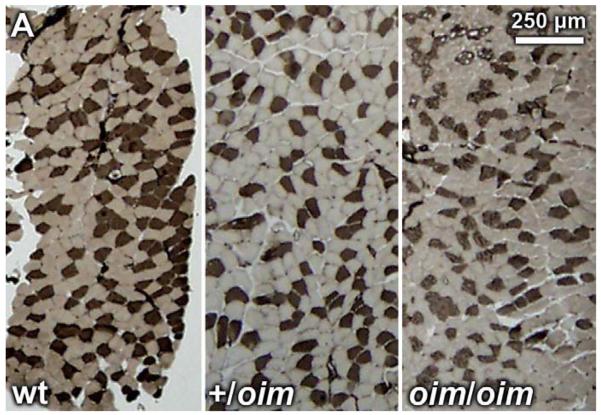
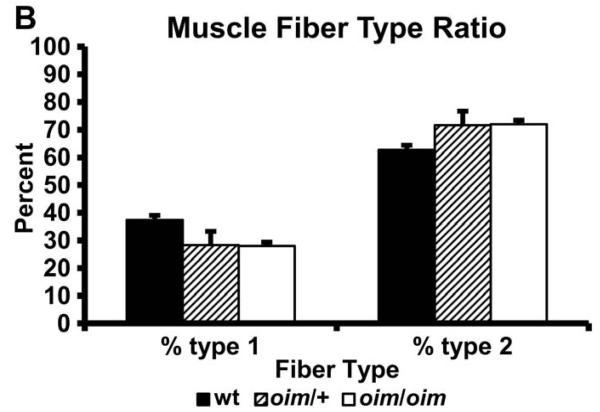
Figure 3.
(A) Myofibrillar ATPase stained (acid preincubation) +/oim (n=3; center) and oim/oim (n=4; right) soleus (S) muscle from 4 month old mice did not show differences in distribution of type I or type II fibers compared to wt (n=3; left) S muscle, 2.5X magnification. The same was true for plantaris (P), gastrocnemius (G), tibialis anterior (TA) and quadriceps (Q) muscles (results not shown). (B) Distribution of type I and type 2 fibers of the S muscle expressed as a percent of total muscle fiber number (mean ± SE).


