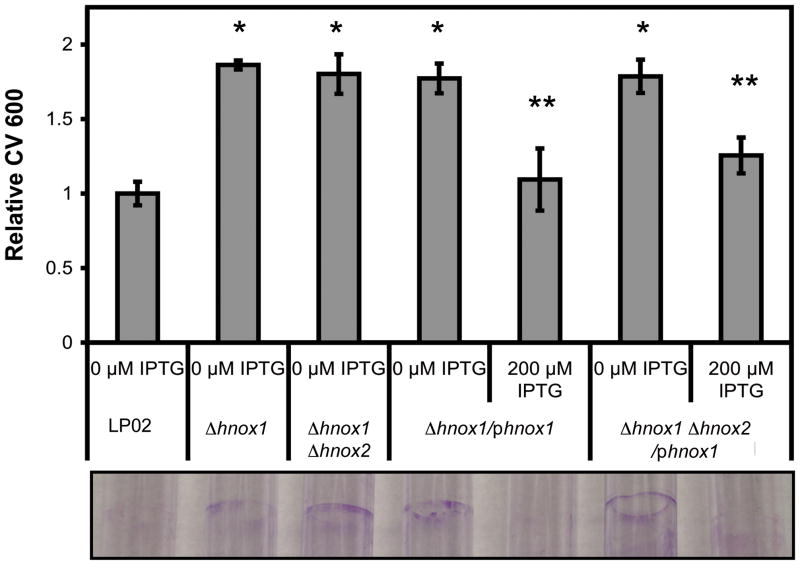
Figure 3.
Complementation of hyper-biofilm phenotype in hnox1 mutants. Biofilms were stained with crystal violet then resuspended in 95% ethanol and the absorbance at 600 nm (CV 600) was measured. Relative CV 600 staining is shown for wild type and mutant strains harboring the pMMB206-GENT vector and the phnox1 vector with and without IPTG induction. Biofilm formation was quantified in 96 well polystyrene microtiter plates (bars) and shown visually in 5 mL polystyrene culture tubes (lower image) at 3 days post-inoculation. *p-values<0.05 for comparison of Δhnox1 or Δhnox1 Δhnox2/pΔhnox1 and LP02. **p-values<0.05 for comparison of uninduced and induced Δhnox1/pΔhnox1 or Δhnox1 Δhnox2/pΔhnox1. Induction of the phnox1 plasmid in LP02 had no effect on biofilm formation (data not shown).

