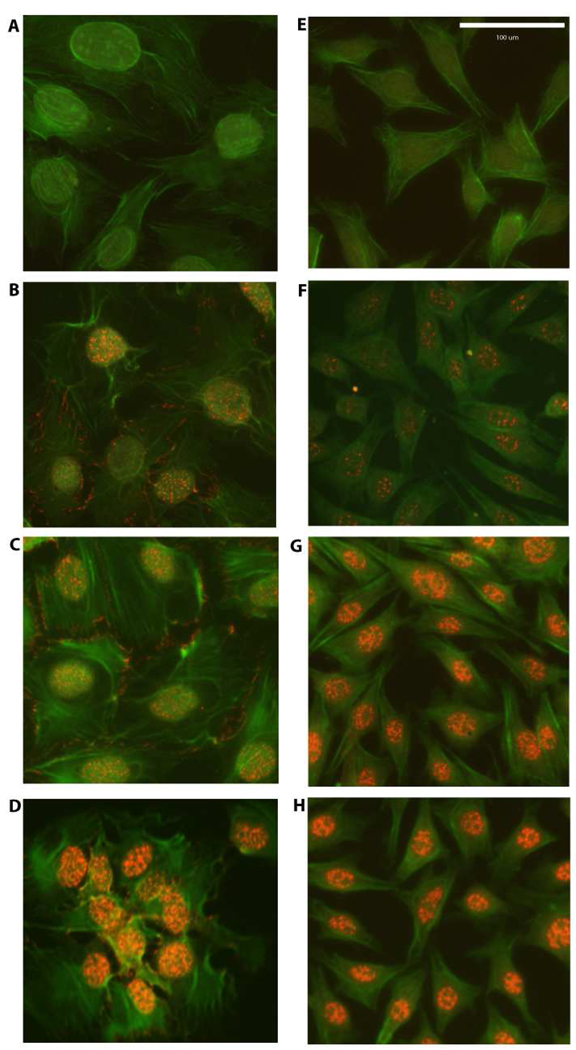
Figure 1.
β-catenin nuclear translocation detected by immunostaining in 2T3 osteoblastic (Panels A–D) and MLO-Y4 osteocytic cells (E–H). Panels A and B are non-immune IgG controls. Panels B and F are static controls. Panels C and G are 2 dynes/cm2 and Panels D and H are cells subjected to 16 dynes/cm2. All cells were photographed at 20X and the green (phalloidin) and red (β-catenin) channels were overlaid in Adobe Photoshop. Scale bar in Panel E is 100 µm and is the same for all panels.

