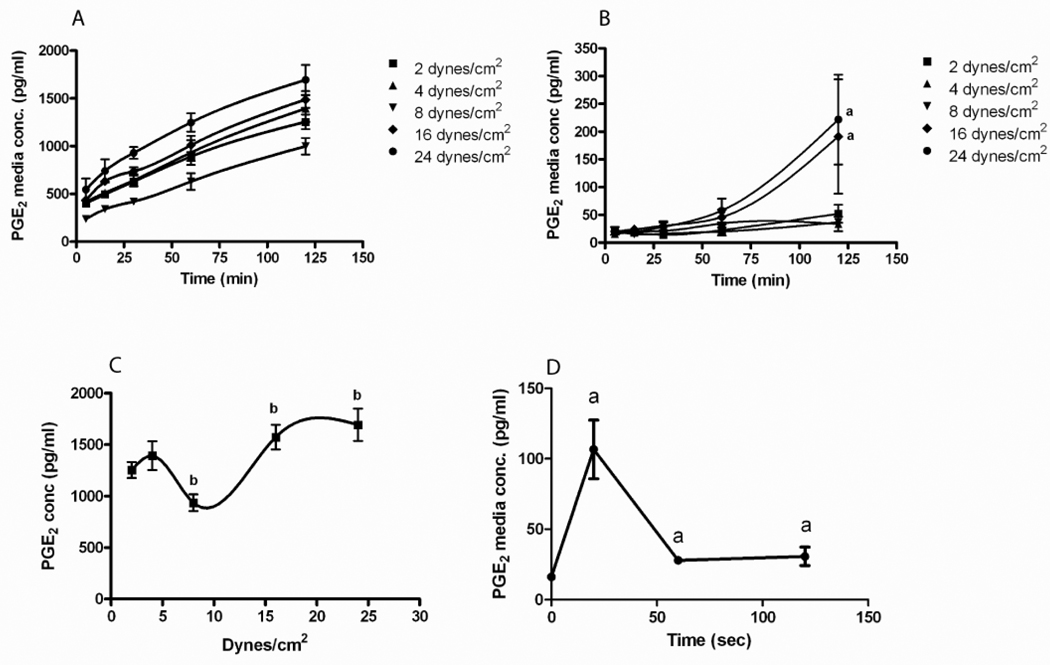
Figure 3.
PGE2 accumulation in the fluid flow media during the application of various levels of pulsatile fluid flow shear stress. MLO-Y4 osteocytic cells (A) and 2T3 osteoblastic cells (B) were subjected to fluid shear stresses as indicated and media sampled at 5, 15, 30, 60 and 120 minutes. All time points in the MLO-Y4 are significantly different compared to static controls at p<.05. Panel C: PGE2 accumulation in the fluid flow media at 120 minutes was plotted versus the level of applied pulsatile fluid flow shear stress. Panel D: PGE2 release was measured at 20 sec, 1 and 2 minutes at 2 dynes/cm2. Data shown are mean ± std dev. n=3. ap<.05 compared to control. bp<.05 compared to 2 dynes/cm2.

