
Figure 4a.
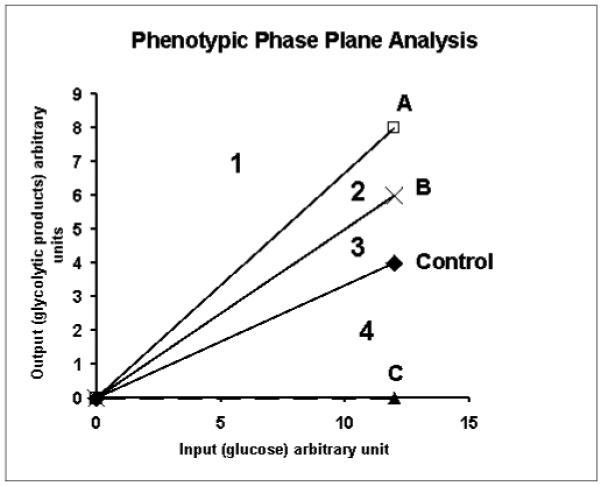
Phenotypic phase plane analysis of metabolic system of Figure 3 demonstrating the use of phenotypic phase plane analysis for metabolic phenotyping. The vectors representing phenotypes of control, A, B, and C divide the phenotypic phase plane in to four regions.