
Figure 5.
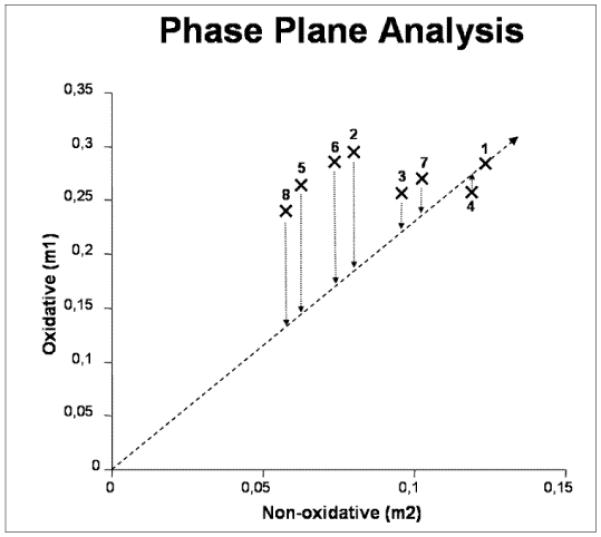
An example of the use of phenotypic phase plane analysis in a study of drug resistance HT29. The observed m1 (oxidative pentose pathway) to m2 (non-oxidative pentose pathway) of cell treated with different combination of drugs are plotted (from Ramos-Montoya et al. [53] with permission). Point #1 is the “control” phenotype of untreated cells; phenotype of oxythiamine (OT) treatment, point #2; dehydroepiandrosterone (DHEA) treatment, point #3 and methotrexate (MTX) treatment, point #4. Phenotypes of the combined treatment are point #5 combined OT+DHEA treatment; point #6 and #7 are for (OT+MTX) and (DHEA+MTX); and point #8, treatment with (OT+DHEA+MTX). Superimposing cell viability on the control phenotype vector creates a new viability axis. The isoclines are lines connecting the degree of cell viability to the metabolic phenotype characterized by (m1, m2).