
Figure 6.
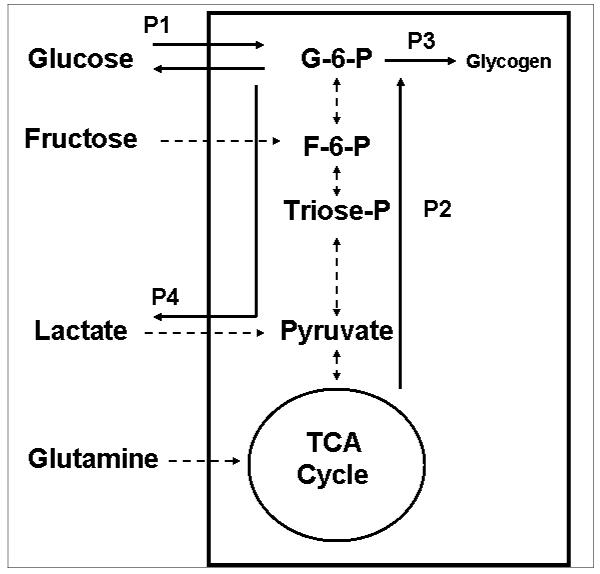
Glucose metabolic network in hepatocytes. The glycolytic and gluconeogenic pathways of hepatocytes were studied by modifying the culture medium conditions, namely, glucose only, glucose + fructose, glucose + lactate and glucose + glutamine. The balance of flux analysis was carried out around glucose-6-phosphate [54]. The resultant extreme pathways are indicated as P1, P2, P3, and P4. The extreme pathways include many internal and external fluxes indicated by the broken arrows.