
Figure 7b.
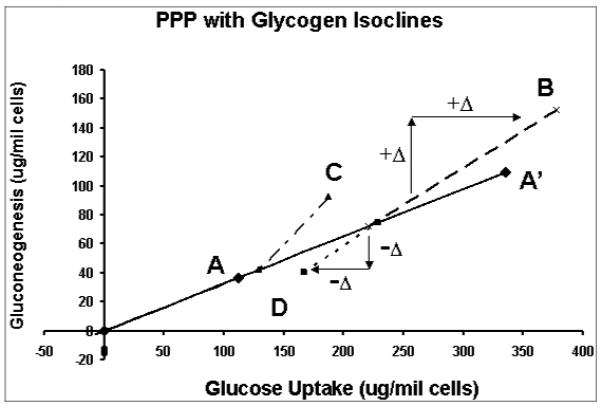
Quantitative comparison of metabolic responses of isolated hepatocytes using glycogen isoclines. The quantities of glycogen produced in the hepatocytes under the different conditions are scaled onto the control vector to construct the isoclines.