
Figure 3.
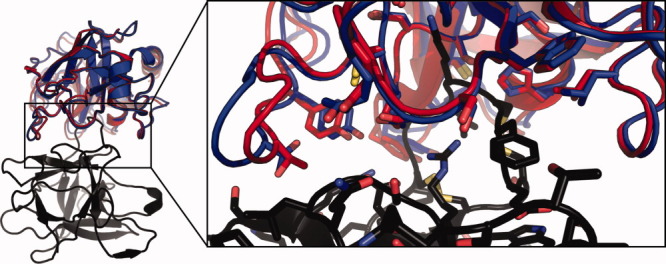
Comparison of the crystal structure of API-A (black) bound with trypsin (red) with the nearest to native submitted model (blue). Residues within 4 Å of the interface are shown in sticks.
Official websites use .gov
A
.gov website belongs to an official
government organization in the United States.
Secure .gov websites use HTTPS
A lock (
) or https:// means you've safely
connected to the .gov website. Share sensitive
information only on official, secure websites.
Comparison of the crystal structure of API-A (black) bound with trypsin (red) with the nearest to native submitted model (blue). Residues within 4 Å of the interface are shown in sticks.