
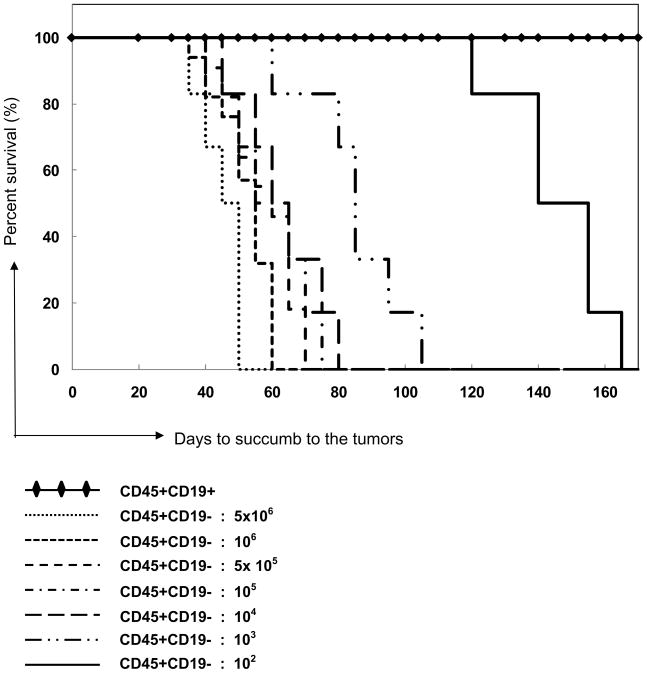
Table 1B. Kaplan-Meier Curves.
Kaplan-Meier curve illustrating the proportion of survival of NOD/SCID mice injected with various doses of CD45+CD19+ or CD45+CD19− MCL-ICs cells. All mice (n=57) injected with CD45+CD19− cells developed MCL-like tumors and were sacrificed due to tumor-related abnormalities. The time to succumb to the tumors differed depending on the dose of injected cells. Mice implanted with CD45+CD19+ fractions did not develop tumors within the range of injected cells (5×10⁶ to ~100 cells, n=56 of 57) and in the time course tested, except for one mouse in passage 2 (see Table S1).
 |